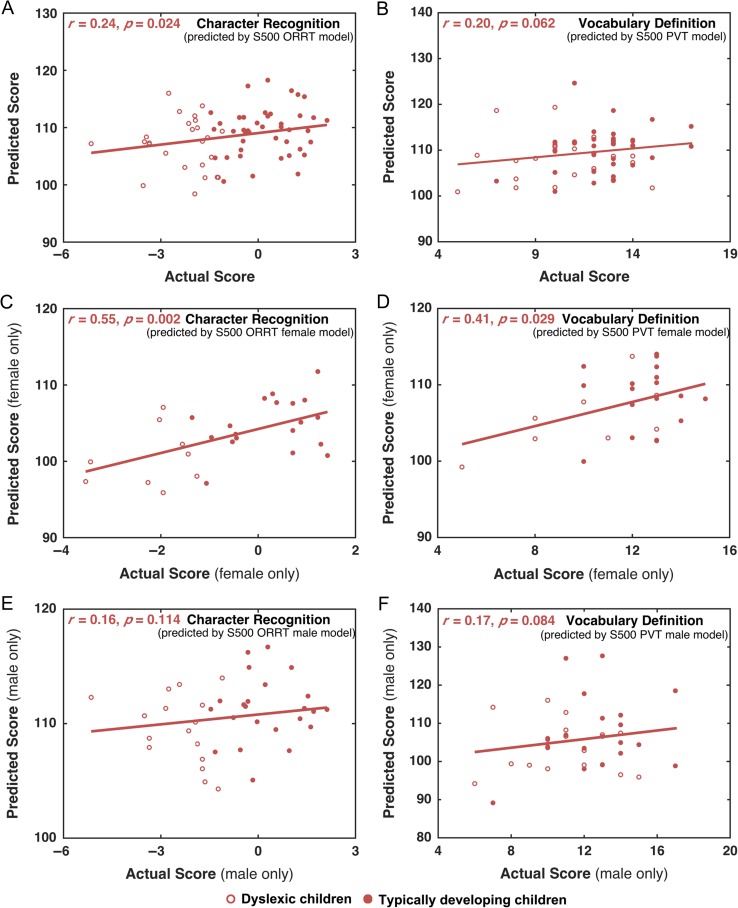
Figure 6.
Prediction performance of the HCP S500-based ORRT and PVT models in the BNU dataset. The scores predicted by the HCP-based ORRT/PVT model and the actual CRT/VDT scores using the whole dataset (A, B), female group (C, D), and male group (E, F) were mostly significantly correlated. All the P values were calculated using the permutation tests (i.e., 1 000 times).

