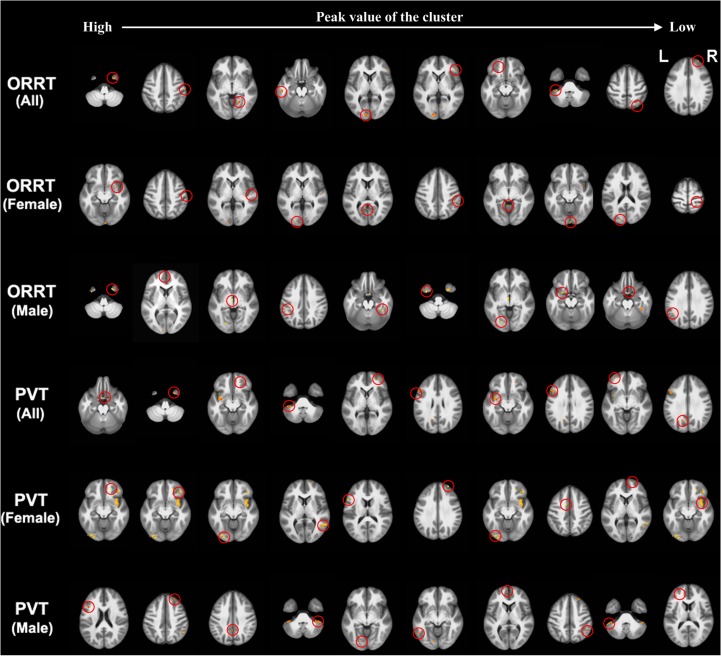
Figure 7.
The most important contributing 10 clusters for the S500 PVT/ORRT prediction models using all subjects, female group, or male group. The clusters are arranged from the left to the right, according to a descending order of the peak value of the cluster. Each cluster was marked out by a red circle. The entire maps showing the spatial pattern of all prediction-relevant GM voxels are illustrated in Supplementary Figure 4.

