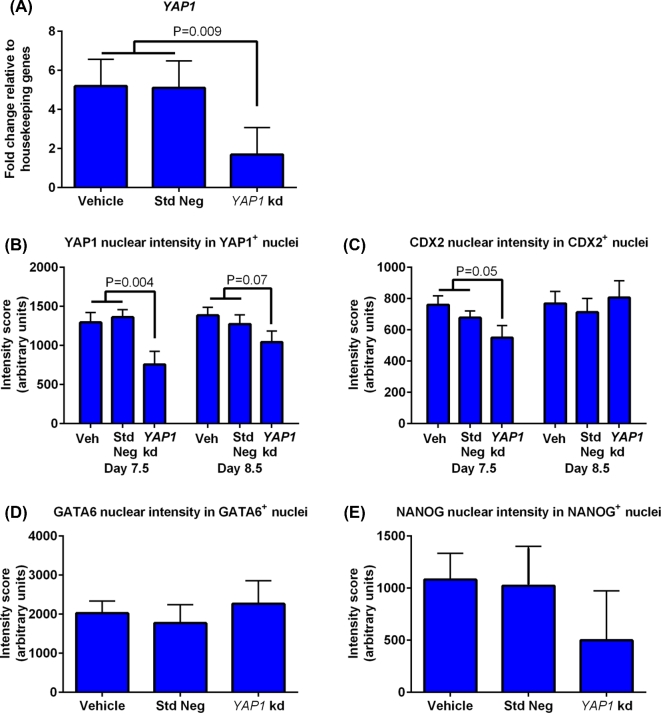
Figure 3.
Amounts of YAP1 mRNA and labeling intensity for CDX2, YAP1, GATA6, and NANOG as affected by treatment with YAP1 targeting GapmeR. (A) Analysis of YAP1 mRNA by high-throughput RT-PCR (Fluidigm) for day 8.5 blastocysts (5 pools per treatment). Data are presented as fold change relative to the geometric mean of housekeeping genes (HPRT1, H2AFZ, and SHDA). (B–E) Intensity of immunoreactive YAP1 (B), CDX2 (C), GATA6 (D), and NANOG (E) in nuclei positive for the same protein. Immunoreactivity of GATA6 and NANOG were measured at day 9.5 only. The number of embryos per group was n = 6 (day 7.5), n = 10 (day 8.5), and n = 3 (day 9.5) for those treated with YAP1 targeting GapmeR; n = 23 (day 7.5), n = 15 (day 8.5), and n = 3 (day 9.5) for those treated with standard negative control GapmeR; and n = 11 (day 7.5), n = 19 (day 8.5), and n = 6 (day 9.5) for those treated with vehicle. Data are least-squares means ± SEM results. The P-values for effects of treatment are indicated by the value above the bars. Std Neg, standard negative control GapmeR; YAP1 kd, YAP1 targeting GapmeR.

