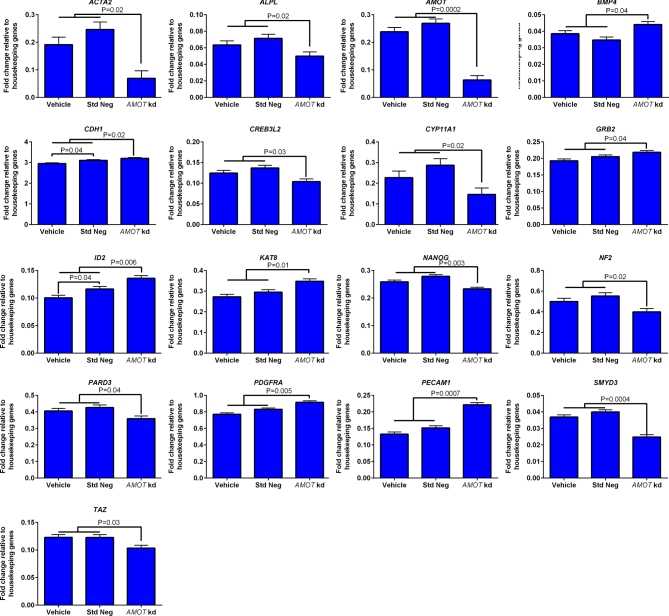
Figure 5.
Genes whose expression was affected by knockdown of AMOT in blastocysts at day 7.5 of development as determined by high-throughput RT-PCR (Fluidigm) (n = 3 pools of blastocysts per group). Data are represented as fold change relative to the geometric mean of housekeeping genes (HPRT1, H2AFZ, and SDHA) and are least-squares means ± SEM. The P-values for effects of treatment are indicated by the value above the bars. Std Neg, standard negative control GapmeR; AMOT kd, AMOT targeting GapmeR.

