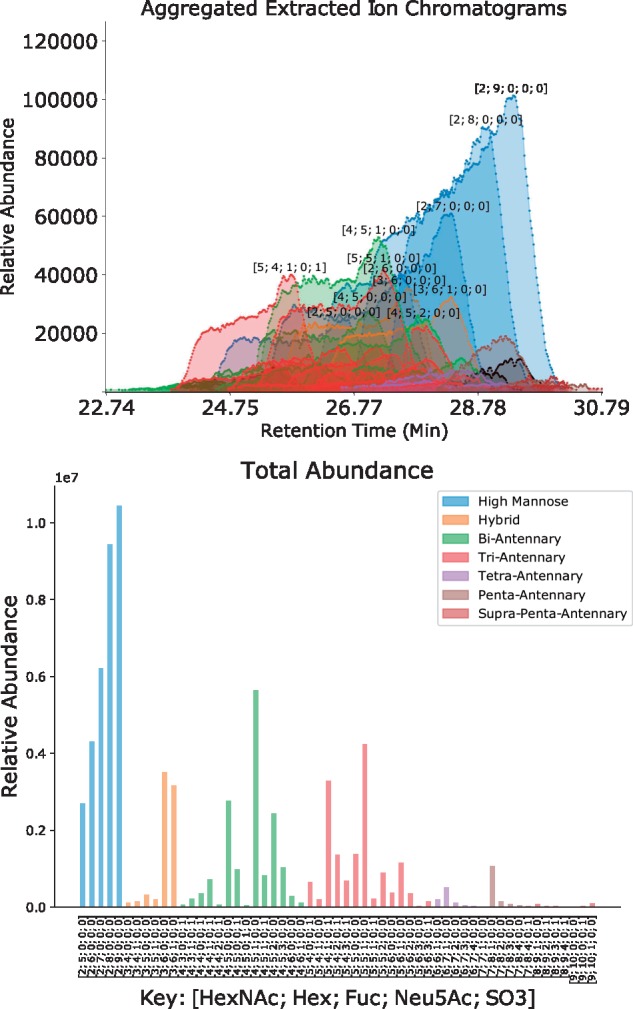
Fig. 1.

Chromatogram Assignments and Quantification for 20141103-02-Phil-BS Using the Combinatorial + Sulfate database. The Retention Time (Min) axis shows the experimental retention time in minutes, and the Relative Abundance axis shows the intensity of the signal from each aggregated ion species. The identified glycan compositions are labeled with a tuple describing the number of each component of the form [HexNAc, Hex, Fuc, NeuAc, SO3] (Color version of this figure is available at Bioinformatics online.)
