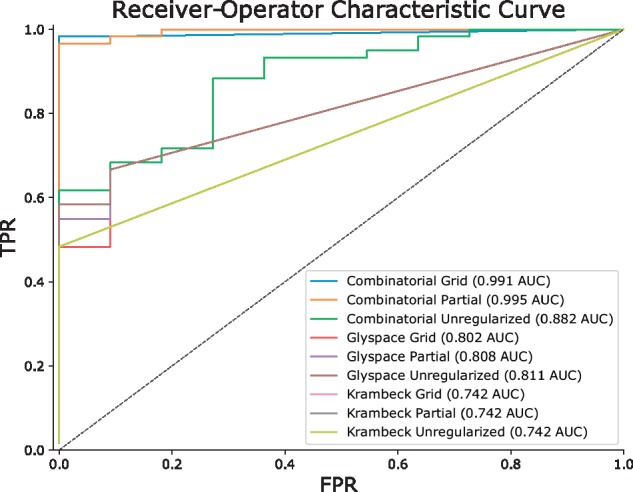
Fig. 2.

Performance Comparison with and without Network Smoothing for 20141103-02-Phil-BS. The Receiver Operator Characteristic Curve (ROC) comparing True Positive Rate (TPR) to False Positive Rate (FPR) shows how each database performed under different regularization conditions, summarized with the Area Under the Curve (AUC) in the legend. The Combinatorial + Sulfate database showed the best performance, and improved with regularization (Color version of this figure is available at Bioinformatics online.)
