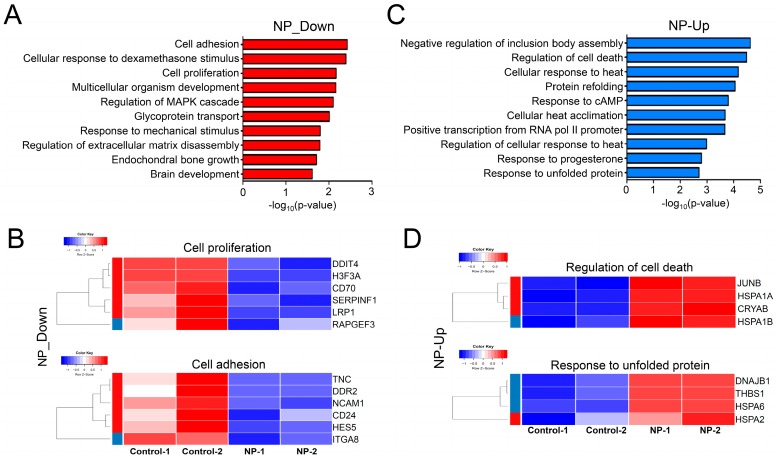
Figure 9.
Analysis of gene ontology for the down- or upregulated genes. (A) Bar graphs displaying the top 10 GO terms in the genes repressed by graphene oxide. The x-axis scale represents -log10(p-values) values. (B) Heatmaps showing the expression of genes in the GO terms of cell proliferation and cell adhesion. NP, nanoparticle. (C) Bar graphs displaying the top 10 GO terms in the genes enhanced by graphene oxide. (D) Heatmaps showing the expression of genes in the GO terms of regulation of cell death and response to unfolded protein.

