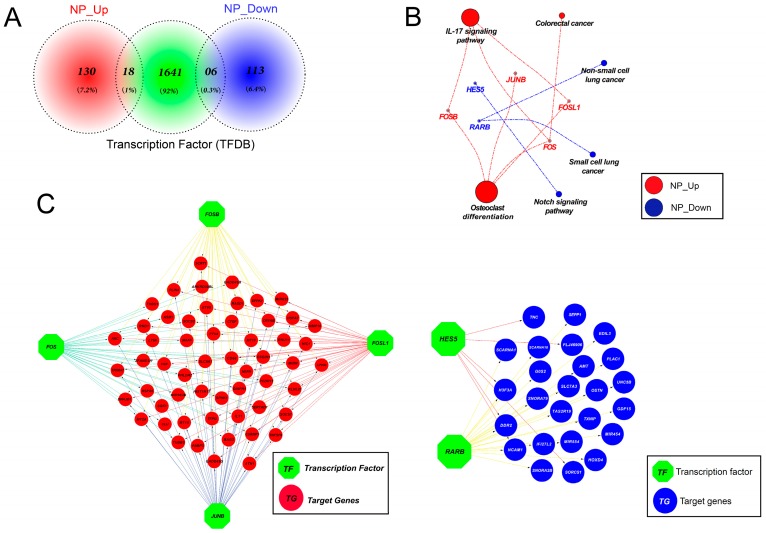
Figure 11.
Graphene oxide altered transcription factor (TF) expression, resulting in changes to downstream gene expression. (A) Venn diagram showing TFs among the DEGs. Eighteen out of 148 upregulated genes and six out of 119 downregulated genes were identified as TFs. (B) KEGG analysis with TFs differentially expressed following graphene oxide exposure. Red color: Upregulated genes; blue color: Downregulated genes. (C) Networks showing differentially expressed target genes downstream of the TFs identified in (A).

