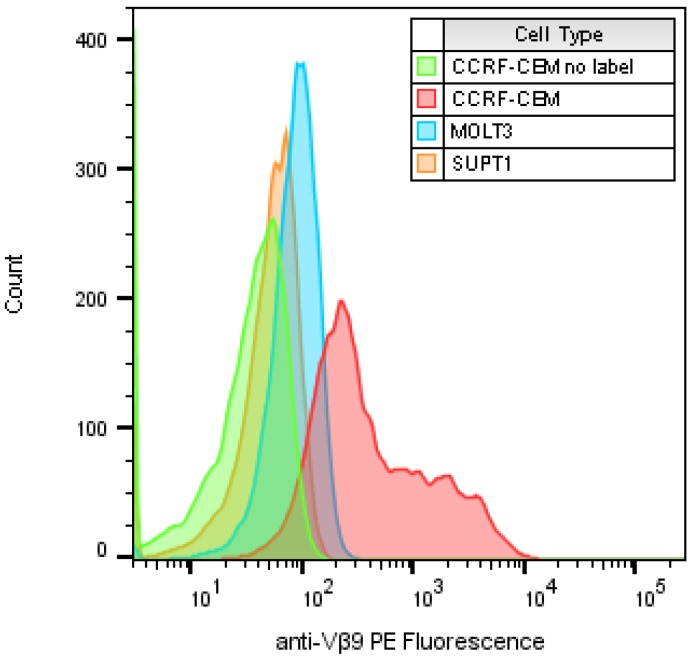
Figure 1.
Flow cytometric analysis to compare the expression of TCR Vβ9 protein on the surface of three T-cell lines. All samples were labeled with PE-anti-Vβ9 except a “no label” CCRF-CEM control with no antibody. The x-axis represents the relative expression level of TCR Vβ9 protein per cell as relative fluorescence intensity on a logarithmic scale and the number of cells at each intensity displayed on the y-axis.

