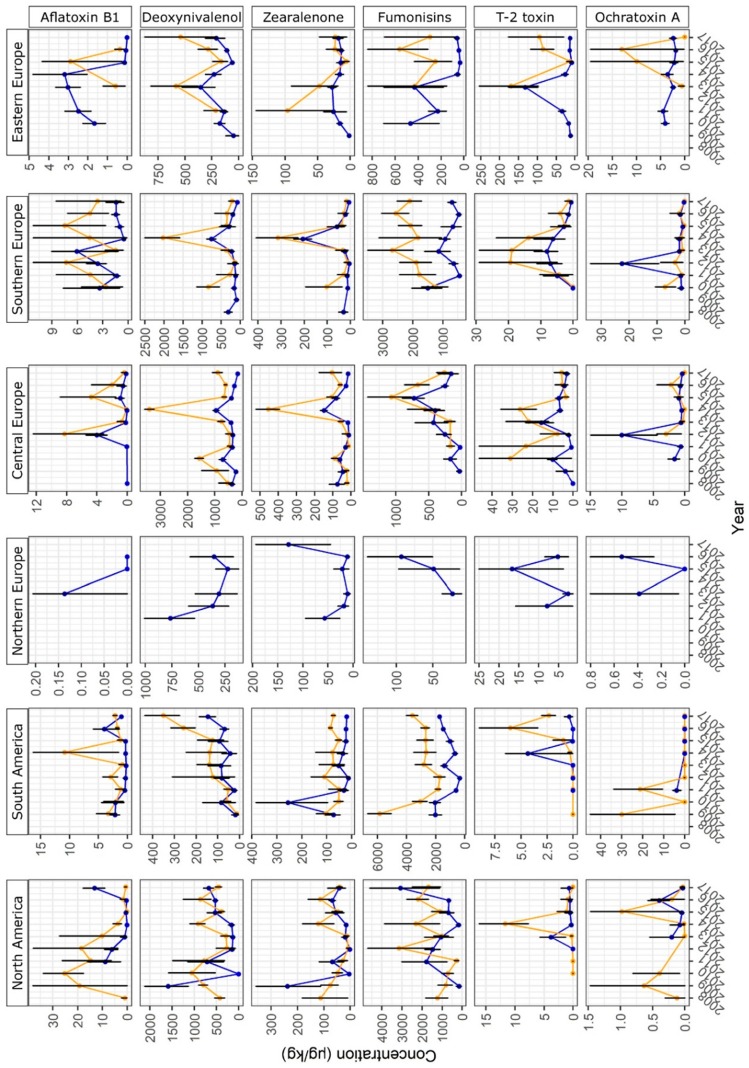
Figure 2.
Year-to-year variation of mycotoxin concentrations in North America, South America, Northern Europe, Central Europe, Southern Europe, and Eastern Europe. The vertical axis shows mean concentrations of mycotoxins (Bayesian mean with error bars for 95% confidence level; see the Materials and Methods section for details on statistical analysis). The horizontal axis shows harvest years 2008–2017. Taking into account approximate seasons of crop growth and harvest, a year was defined to start in April and end in March of the subsequent calendar year for South America or to start in October and end in September of the subsequent calendar year for all other regions. Yellow circles and lines indicate maize samples. Blue circles and lines indicate finished feed samples. Data points are shown if ≥ 20 samples per year were available.

