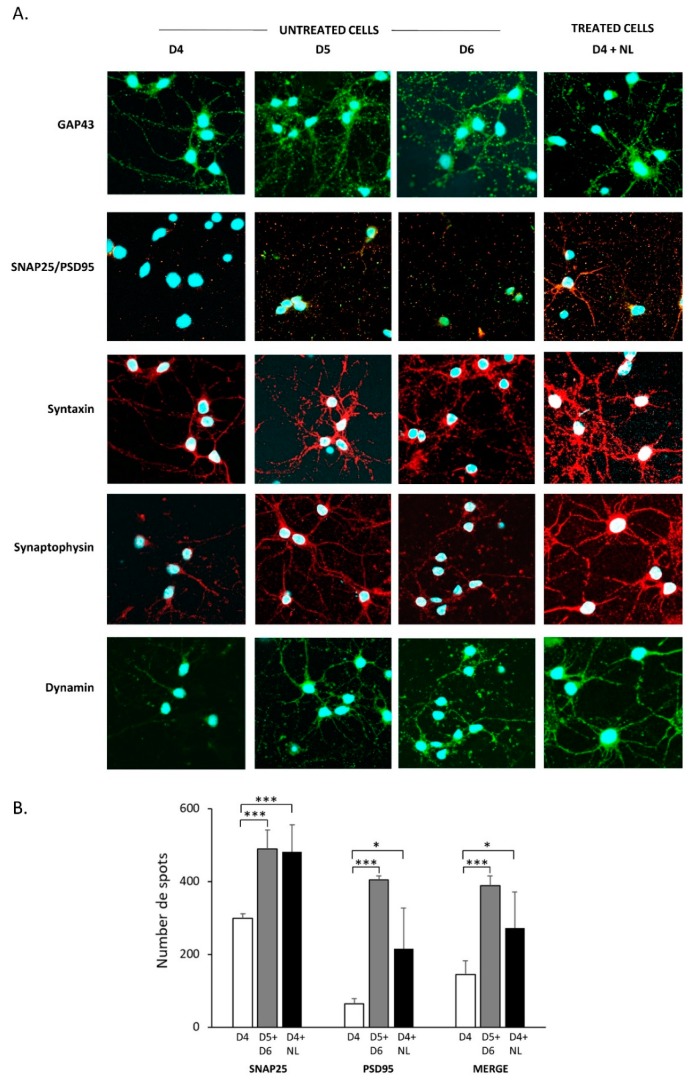
Figure 4.
Cell localization of synaptic markers in primary cultures of cortical neurons treated with fish nanoliposomes (NL). (A). Immunofluorescence was used to detect different synaptic markers in primary cultures of rat embryo cortical neurons at the indicated times (D = days in vitro); D4 + NL are cells incubated 24 h with 10 µg/mL NL between D3 and D4; D4, D5, and D6 are control cells incubated in the absence of NL and recovered on D4, D5, and D6. Representative images are shown here obtained using the confocal microscope (120× magnification, Fluoview Fv10i, Olympus). (B). Image analysis of SNAP24/PSD95 labeling. The number of labeled spots of SNAP25 (red), PSD95 (green) and SNAP25 + PSD95 together (merge, orange), indicating colocalization are indicated for untreated cells on D4 (open bar, n = 4), on D5 and D6 (combined data shown as gray bar, n = 3), and for NL-treated cells on D4 (solid bar, n = 8). Statistically significant differences are shown as compared to the untreated cells (D4) for the corresponding label measured (* p < 0.05, *** p < 0.001).

