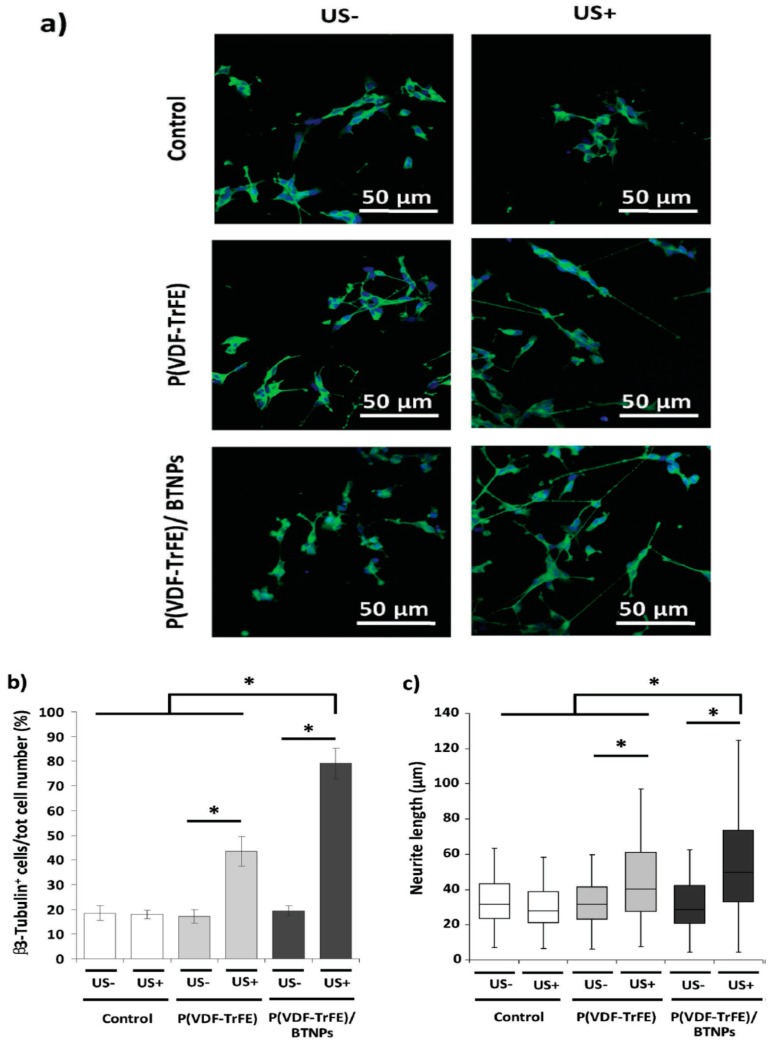
Figure 28.
(a) Confocal fluorescence microscopic images of SH-SY5Y cells on solvent-cast P(VDF-TrFE) and P(VDF-TrFE)/BTNP films, as well as Ibidi (control) at the end of differentiation period of 6 days. SH-SY5Y cells were treated with or without ultrasound stimulation (US+ or US−). β3-tubulin was stained in green, nuclei in blue. (b) Percentages of β3-tubulin positive cells. (c) Neurite lengths are expressed as median values ± confidence interval at 95%. * p < 0.05. Reproduced with permission from [182], published by Wiley-VCH, 2016.

