Figure 5.
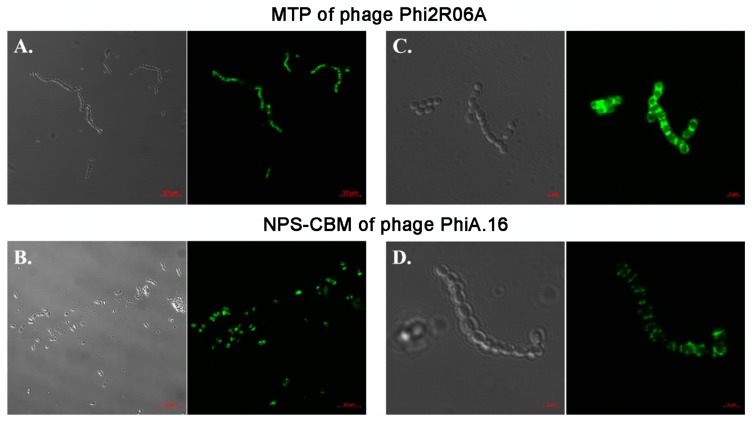
Binding assays of GFP-labelled MTP of Phi2R06A (A + C) and NPS-CBM of PhiA.16 (B + D). (A) Binding of GFP-labelled TpeX of the MTP of Phi2R06A to host strain L. lactis 2. Protein was added at a quantity of 25 μg. (B) Binding of the GFP-labelled NPS CBM domain of PhiA.16 to host strain L. lactis A. Protein was added at a quantity of 100 μg. (C) Binding of the GFP-labelled TpeX of the MTP of Phi2R06A to host strain L. lactis 2 at higher resolution, highlighting the localized nature of binding on the cell. Protein was added at a quantity of 25 μg. (D) Binding of GFP-labelled NPS CBM domain of PhiA.16 to host strain L. lactis A at higher resolution, highlighting the localized nature of binding on the cell. Protein was added at a quantity of 100 μg. Cells were visualized using differential interference contrast (DIC) microscopy (panels on the left), and fluorescent confocal microscopy (panels on the right) at the GFP excitation wavelength of 488 nm. Scale bars correspond to 10 μm in (A) and (B), and 2 μm in (C) and (D). Negative controls are provided in Figure 6 (MTP) and in Supplementary Figure S8 (NPS).

