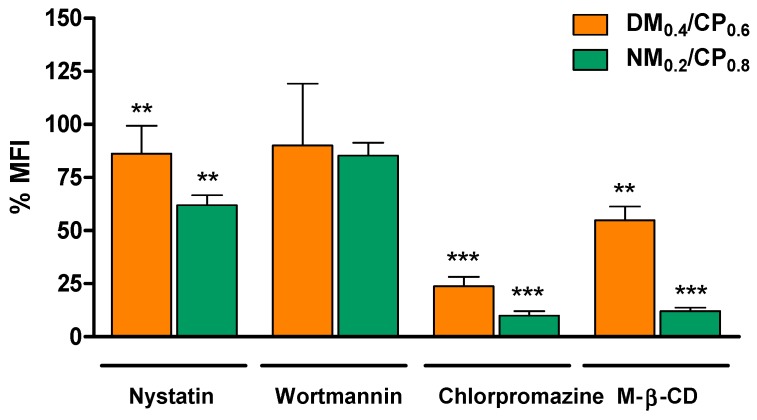
Figure 5.
Cellular uptake of polyplexes (DM0.4/CP0.6 polyplexes: N/P ratio = 5 and NM0.2/CP0.8 polyplexes: N/P ratio = 4) after treatment with nystatin (10 µg/mL), wortmannin (12 ng/mL), chlorpromazine (10 µg/mL), and methyl-β-cyclodextrin (M-β-CD) (3 mg/mL) as evaluated by flow cytometry and presented as median fluorescence intensities (MFI). (Results are shown as mean ± SD as percentage of median fluorescence intensity related to not inhibited samples, n = 3, two-way ANOVA with Bonferroni post-hoc test, ** p < 0.01, *** p < 0.005).

