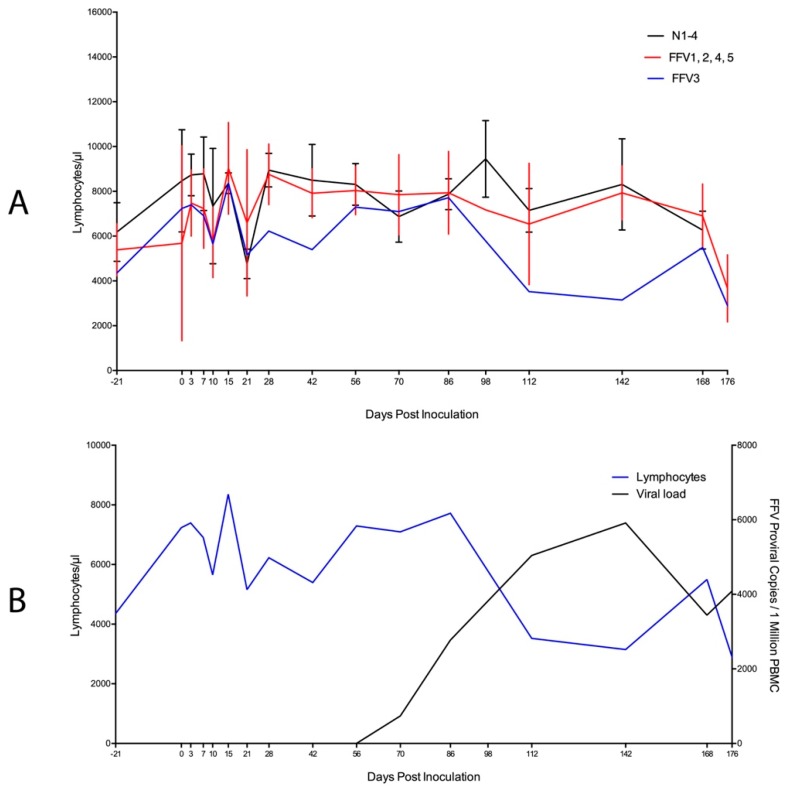
Figure 3.
High viral load correlates with decline in circulating lymphocytes in cat FFV3. (A) Absolute lymphocyte population numbers determined through complete blood count for cat FFV3 (blue line) appeared to decrease over time compared to all other cats in the study. Naïve cats are grouped on the black line and the rest of the FFV-group cats are displayed on the red line; (B) A significant negative correlation (r = −0.653, P = 0.006) was found between lymphocytes and FFV proviral load [10] in cat FFV3 as lymphocyte population numbers (blue line) decreased and proviral load (determined by qPCR, black line) increased over time. Bars denote standard deviation.

