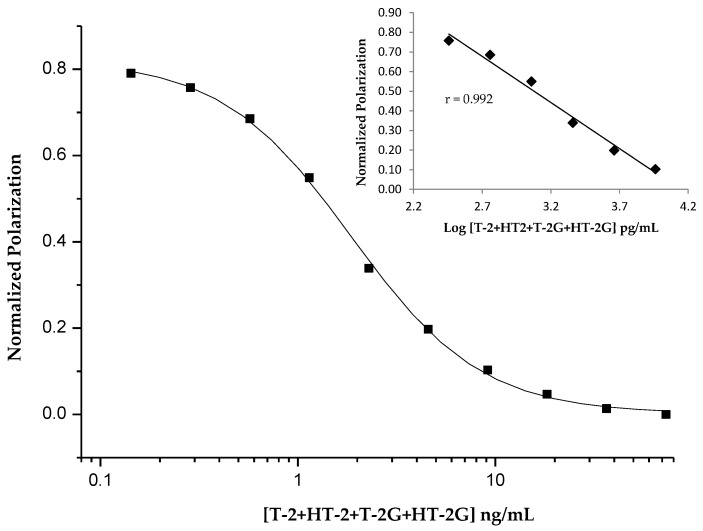
Figure 2.
Normalized calibration curve of the selected FPIA obtained with mixed standard solutions of T-2, HT-2, T2-glucoside and HT2-glucoside (expressed as sum, ratio 1:1:0.5:0.5) in PBS-A solution ([Anti-HT2] = 8 µg/mL; [HT2-FL1a] obtained after dilution 1:3000 (v/v) of the stock solution, see Table 1). The FP linearity range vs. log [T-2 + HT-2 + T-2G + HT-2G] is reported in the insert. Values of the x-axes are the toxin concentrations in the final test solution.

