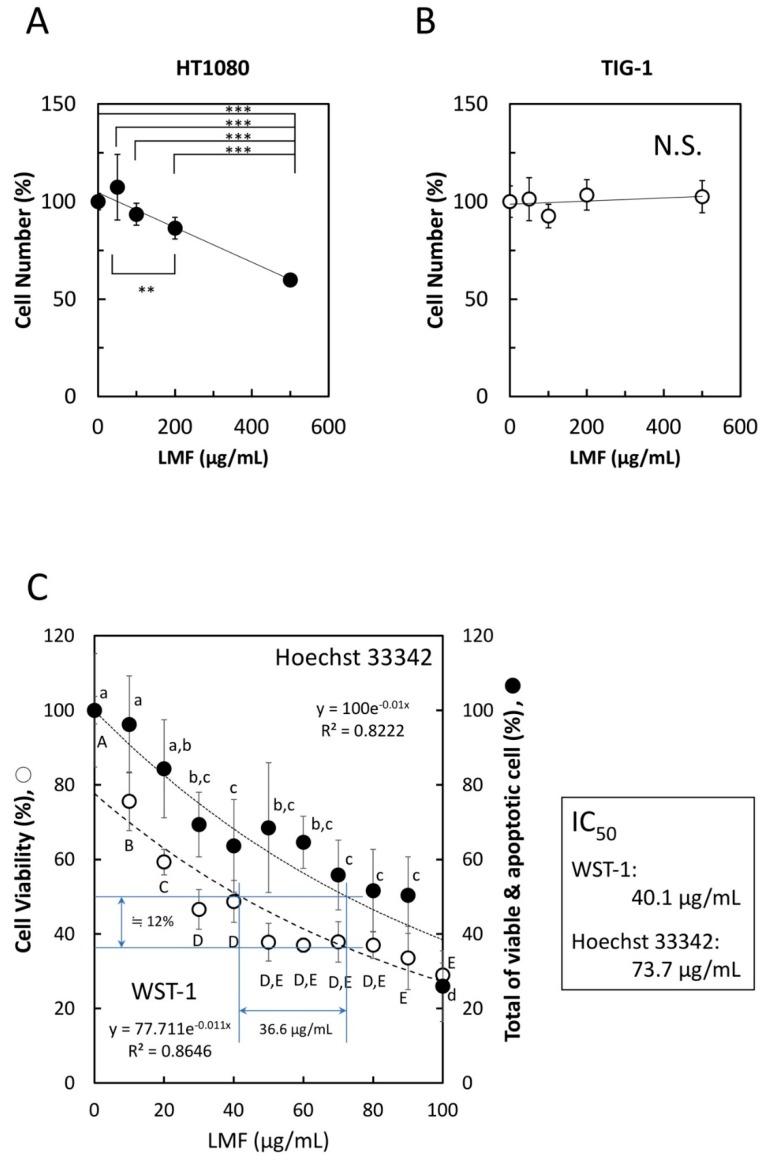
Figure 3.
Effects of low molecular weight fucoidan extract (LMF) on cancer cell and normal cell growth. (A) HT1080 cells (1 × 10⁴ cells/mL) and (B) TIG-1 cells (3 × 10⁴ cells/mL), were plated (100 µL per well) in a 96-well microplate. After 24 h, varying concentrations (0, 50, 100, 200, 500 µg/mL) of LMF were added, the cells were incubated for another 48 h, and live cell numbers in each well were measured by the WST-1 assay. The measured values were used for statistical analyses by Student’s t-test. (C) Effect of lower LMF concentrations on HT1080 cell growth was examined using varying concentrations (0, 20, 40, 60, 80, 100 µg/mL) of LMF. After 48 h of treatment, cellular metabolic activity-based live cell numbers were measured by WST-1 (open circles, ○), and live cell numbers were measured by Hoechst 33342 DNA staining (closed circles, ●). The number of fucoidan untreated HT1080 cells was set to 100% to calculate the relative values of fucoidan-treated HT1080 cells. Statistical significance was determined by ANOVA with Tukey test. Different letters indicate statistically significant differences between each letter (p < 0.05). Half-maximal inhibitory concentration (IC50) values were calculated using approximation formulae.

