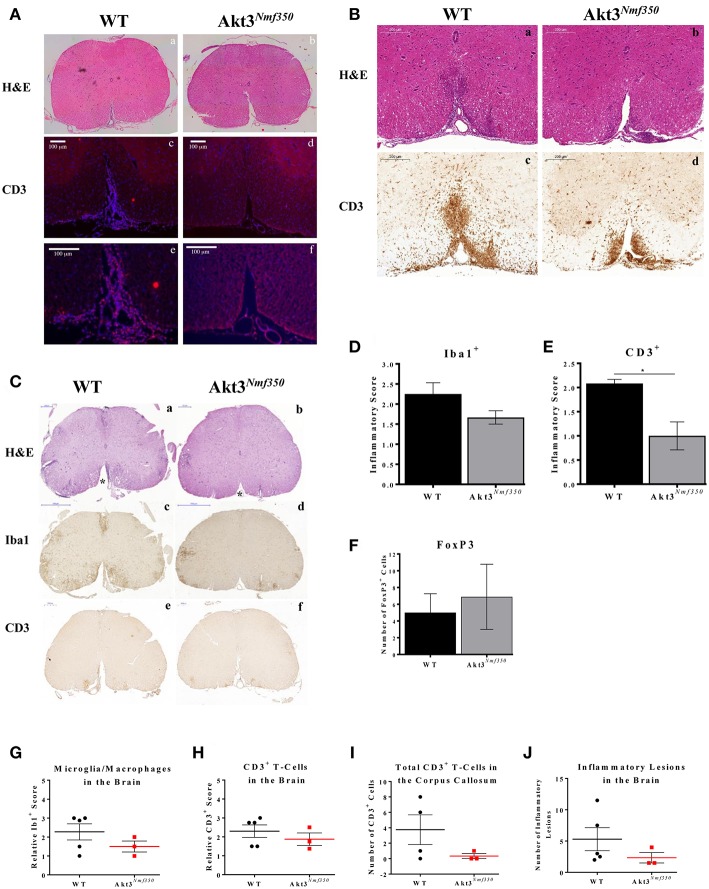
Figure 2.
Akt3Nmf350 mice have a delay in the influx of inflammatory cells into the CNS during EAE and less CD3+ T-cells in the spinal cord during chronic EAE. (A) Representative lumbar spinal cord sections from WT (n = 3) (CI = 1) and Akt3Nmf350 (n = 5) (CI = 0) mice at 10 days post-MOG sensitization. (a,b) H&E and (c,f) CD3+ T-cell infiltrates (scale bar = 100 μm). (B) Representative lumbar spinal cord sections from WT (n = 3) (CI = 1) and Akt3Nmf350 (n = 3) (CI = 1) mice at EAE onset. (a,b) H&E and (c–f) CD3+ T-cell infiltrates (scale bar = 200 μm). (C) Representative sections from WT (n = 4) and Akt3Nmf350 (n = 6) mice after 10 days with consecutive clinical scores (chronic EAE). (a,b) H&E staining of lumbar spinal cords (scale bar = 200 μm). Asterisks (*) point to ventral funiculus. (c,d) Iba1 immunostaining quantified in (D) (scale bar = 500 μm). (e–f) CD3+ T-cell infiltrates quantified in (E) (scale bar = 200 μm). (F) Number of FOXP3+ cells in the lumbar spinal cord during chronic EAE, WT (n = 4) and Akt3Nmf350 (n = 3). (G) Quantified Iba1+ microglia/macrophages and (H) CD3+ cells in the brain sections of Akt3Nmf350 (n = 3) vs. WT (n = 5) mice. (I) Total CD3+ cells the corpus callosum. (J) Total number of inflammatory lesions in the brain (*p = 0.05, Mann-Whitney U-test).

