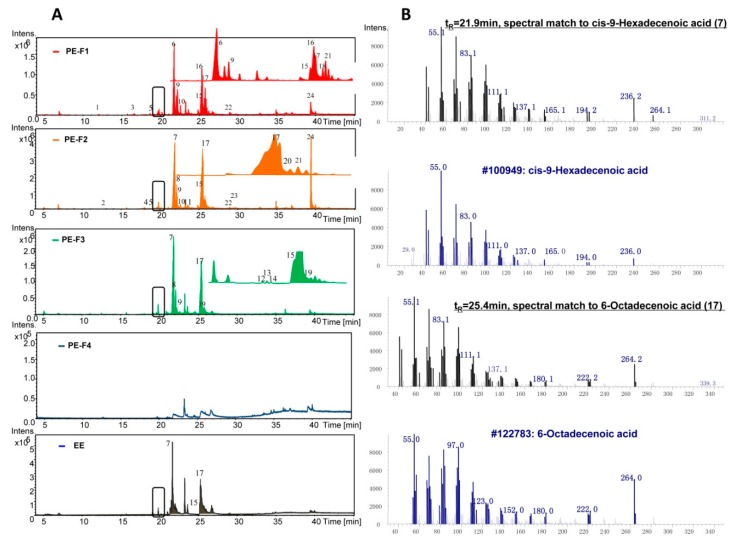
Figure 4.
(A) The gas chromatograph-mass spectrometry (GC-MS) chromatograms of PE and EE. The lipophilic fractions of PE, Fraction(Fr.)1-3, and EE were subject to GC-MS profiling and the resulting MS spectra were compared with the reference compounds in the NIST08 database. The peak number in Figure 4A indicates the putative identification of known compounds with the matching degree ≥ 95%. (B) Two major identified compounds matching to Z-9-hexadecenoic acid and 6-octadecenoic acid with a matching degree of 99% at tR = 21.9 min and tR = 25.4 min in PE and EE. The black boxes in Figure 4A indicate unassigned compounds in the NIST08 database.

