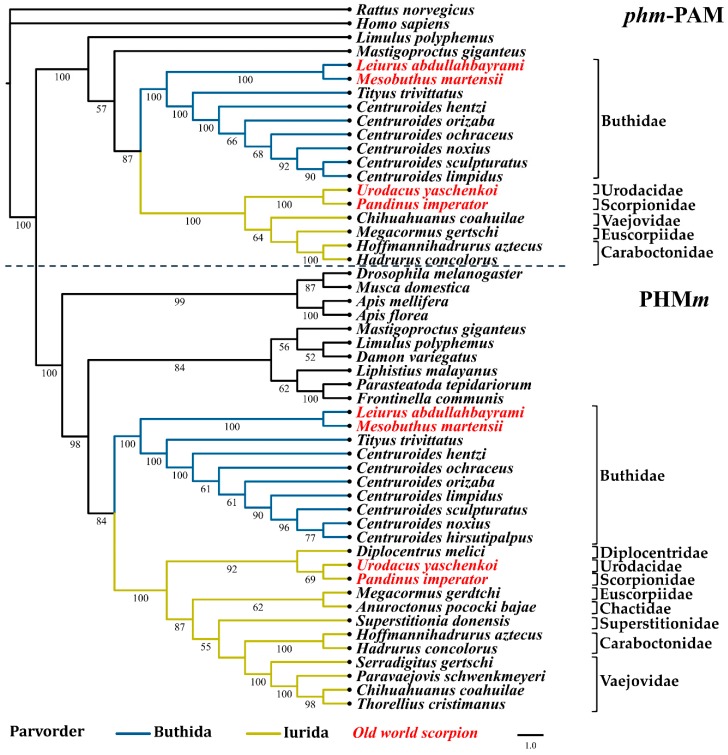
Figure 4.
Reconstructed evolutionary history of the phm-PAM and PHMm domains. Maximum likelihood analyses were performed with nucleotide sequences corresponding to the respective domains. Numbers under the nodes indicate the values of ultrafast bootstrap (UFBoot) (only branches with values higher that 50 are shown).

