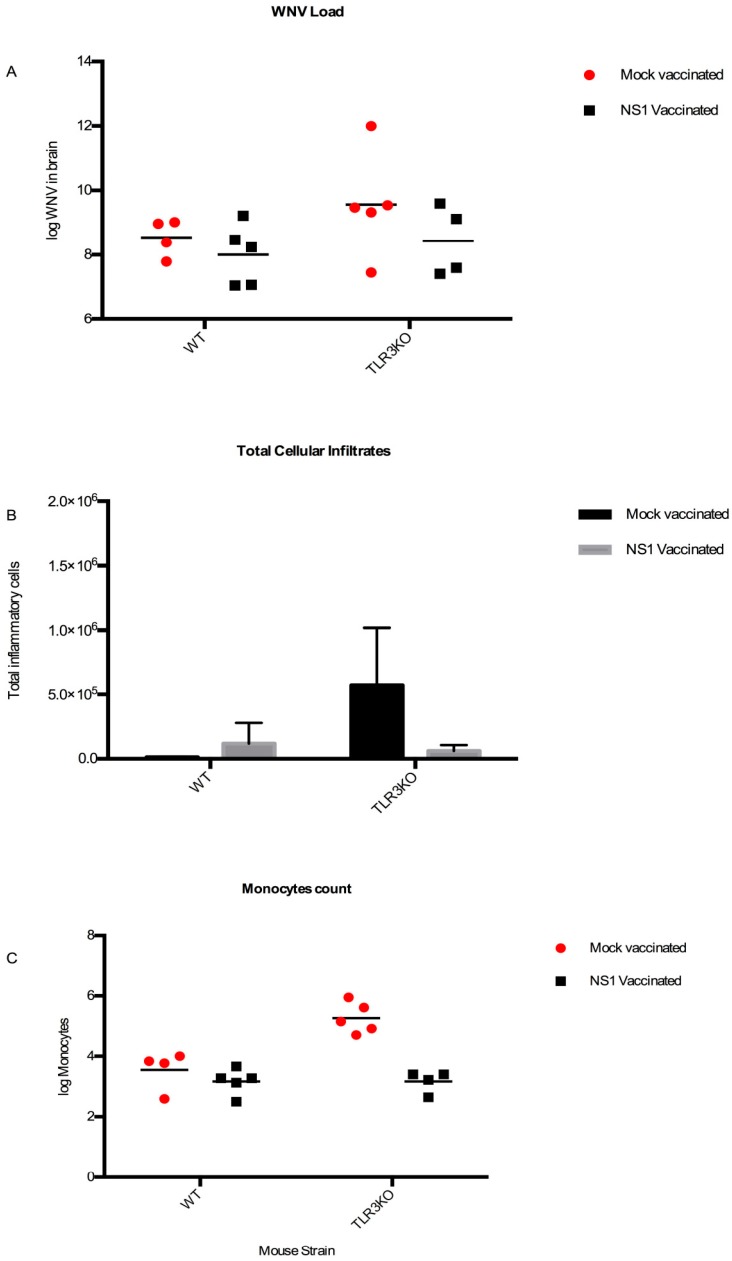
Figure 7.
WNV loads and total cellular and monocytic infiltrates after NS1- or mock-vaccination. (A) log WNV viral copies per mL (y-axis) in the brains of the WNV-positive NS1- and mock-immunized mice, respectively. (B) The number of granulocytes, monocytes, and lymphocytes were added to each other to give the total amount of infiltrating inflammatory cells in the brains (y-axis) of the same mice. (C) log monocyte counts in the brains (y-axis) of WNV-positive NS1- (black) and mock- (red) immunized mice, respectively.

