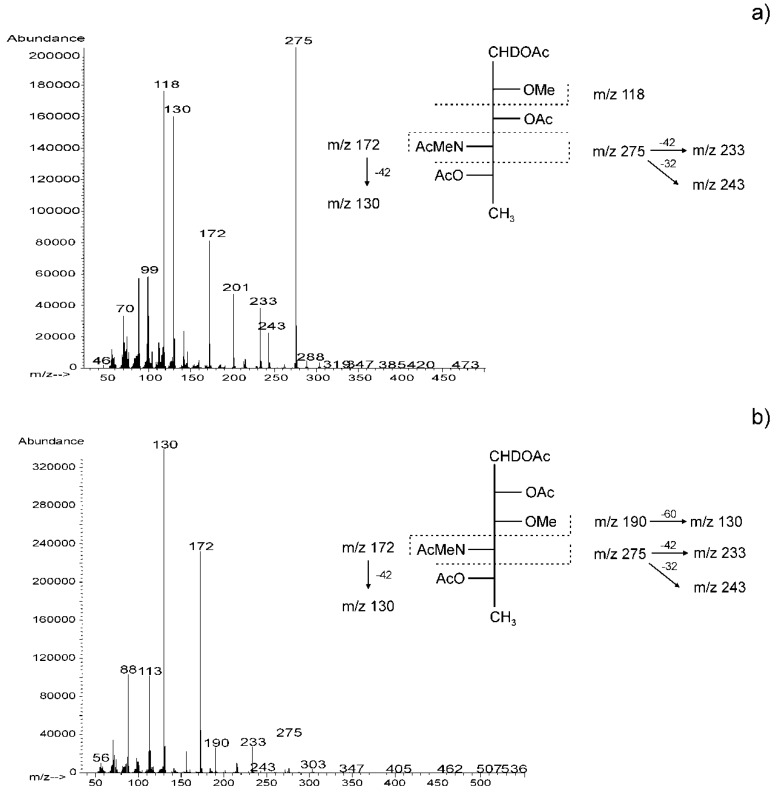
Figure 4.
EI (electron impact) mass spectra and fragmentation pathways of 1,3,5-tri-O-acetyl-4,6-dideoxy-2-O-methyl-4-(N-methyl)acetamido)-mannitol-1-d (a) and 1,2,5-tri-O-acetyl-4,6-dideoxy-3-O-methyl-4-(N-methyl)acetamido)-mannitol-1-d (b) obtained from the O-PS of A. veronii bv. sobria strain K557. Diagnostic primary and secondary fragment ions are indicated. The mass difference 42, 60, or 32 indicates loss of chetene, acetic acid, or methanol, respectively.

