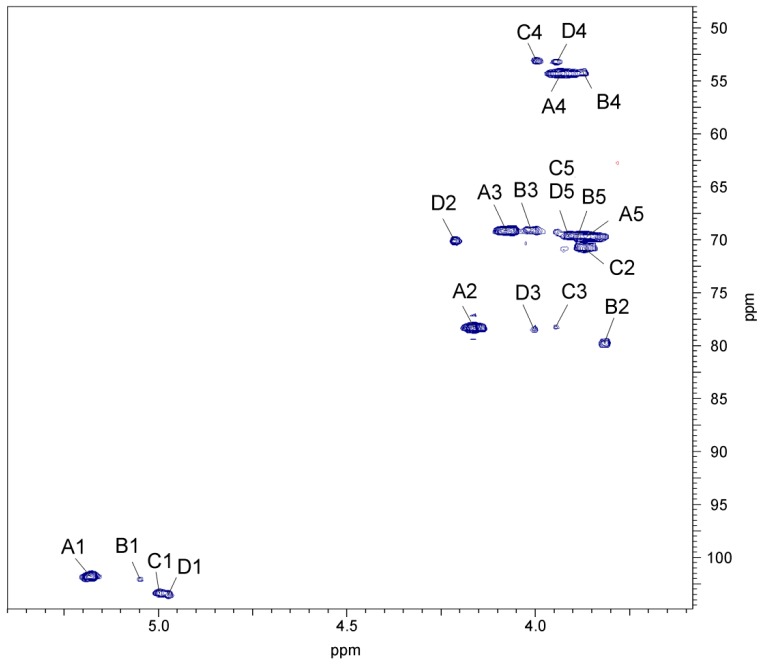
Figure 6.
Part of a 1H,13C HSQC spectrum (500 x 125 MHz) of the O-PS of A. veronii bv. sobria strain K557. The spectrum was recorded at 32 °C in D2O as a solvent. Capital letters and Arabic numerals refer to atoms in sugar residues denoted as shown in Table 3.

