Figure 1.
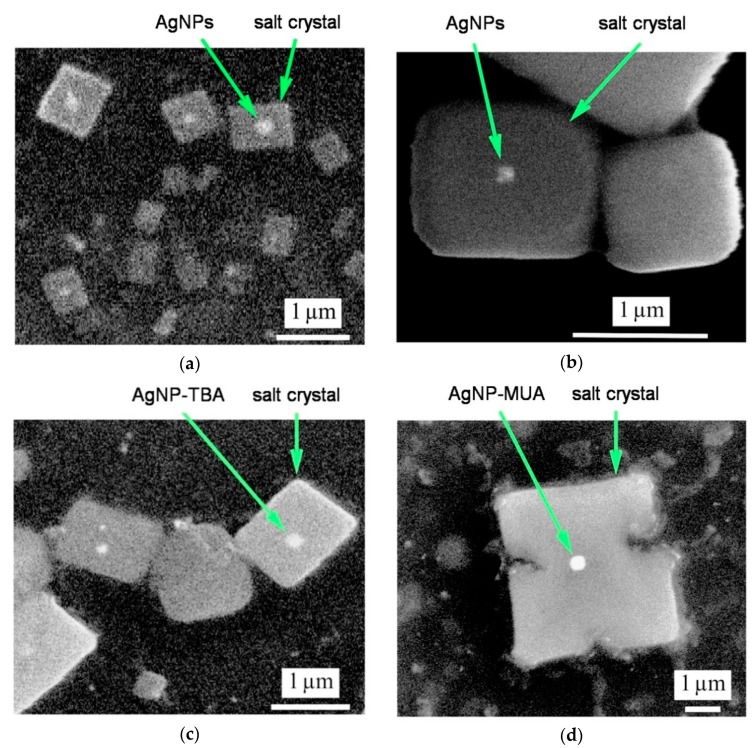
Scanning electron microscopy (SEM) micrographs of synthesized silver nanoparticles (AgNPs): (a) SEM micrograph of naked AgNPs. Arrows indicate AgNPs and salt crystals; (b) Magnified zone of naked AgNPs showing the salt crystal; (c) Micrograph showing of AgNP-thiobarbituric acid (TBA) nanoparticles and concomitant salt crystals; (d) Magnified view of AgNP-11-mercaptoundecanoic acid (MUA) nanoparticles within a salt crystal.

