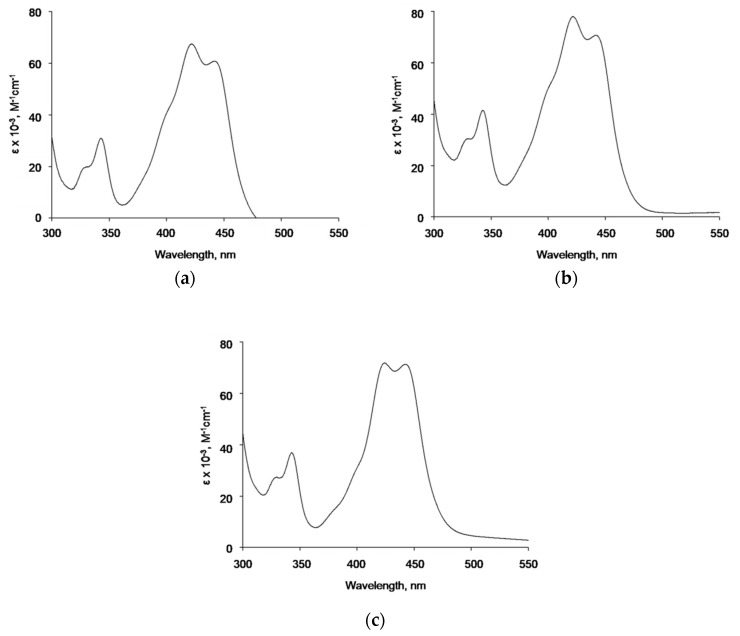
Figure 4.
UV/vis spectrum of AgNPs titrated with ICR-191 reduced by AgNPs’ absorbance. (a) Spectrum of naked AgNPs (initial concentration 64.63 µg/mL) titrated with ICR-191 (concentration range 25.19–97.92 µM); (b) spectrum of AgNP-TBA (initial concentration 19.67 µg/mL) titrated with ICR-191 (concentration range 25.01–97.23 µM); (c) spectrum of AgNP-MUA (initial concentration 6.45 µg/mL) titrated with ICR-191 (concentration range 23.28–90.68 µM).

