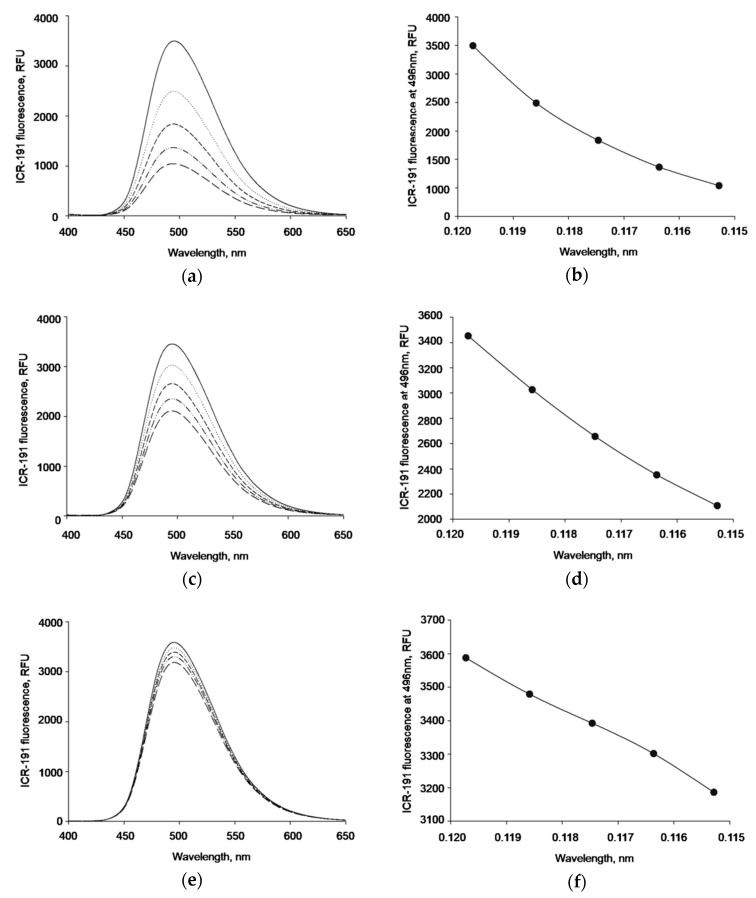
Figure 5.
ICR-191 fluorescence changes caused by AgNPs. (a) Fluorescence emission spectrum of ICR-191 (primary concentration: 119.73 µM) titrated with increasing amount of naked AgNPs (concentration range: 25.30–98.38 µg/mL); (b) data registered for naked AgNPs shown as a relationship between the fluorescence intensity at the maximum point (496 nm) and the ICR-191 concentration; (c) fluorescence emission spectrum of ICR-191 (primary concentration: 119.73 µM) titrated with increasing amount of AgNP-TBA (concentration range: 5.97–23.20 µg/mL); (d) data registered for AgNP-TBA shown as a relationship between the fluorescence intensity at the maximum point (496 nm) and the ICR-191 concentration; (e) fluorescence emission spectrum of ICR-191 (primary concentration: 119.73 µM) titrated with increasing amount of AgNP-MUA (concentration range: 0.63–2.43 µg/mL); (f) data registered for AgNP-MUA shown as a relationship between the fluorescence intensity at the maximum point (496 nm) and the ICR-191 concentration. RFU—relative fluorescence unit.

