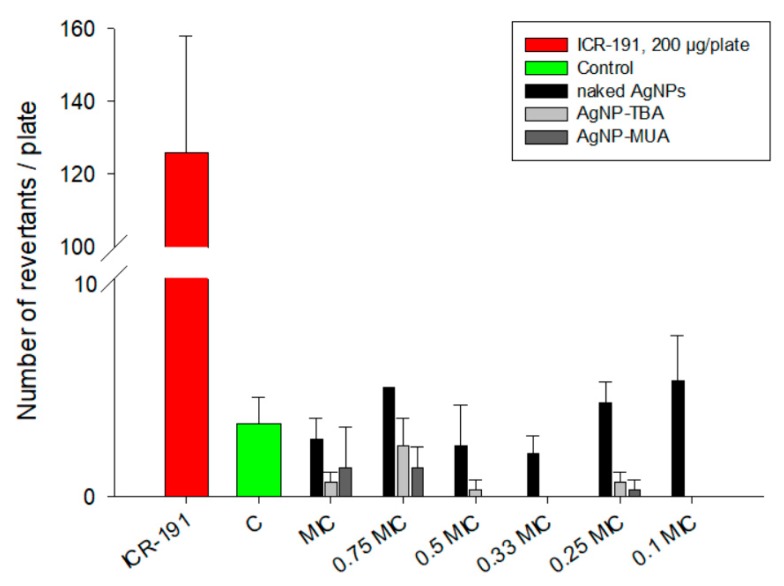
Figure 8.
Mutagenic activity of different AgNPs in S. typhimurium TA98 mutagenicity test: 200 µg/plate of ICR-191 was used as a positive control (red column). C—negative control, bacteria incubated with water. Purple columns represent bacteria incubated with naked AgNPs in a 0.09–0.9 µg/mL concentration range. Light blue columns represent bacteria incubated with AgNP-TBA in a 0.078–0.78 µg/mL concentration range. Navy blue columns represent bacteria incubated with AgNP-MUA in a 0.066–0.66 µg/mL concentration range. Results are reported as mean number of revertants ±SD. MIC—minimum inhibitory concentration.

