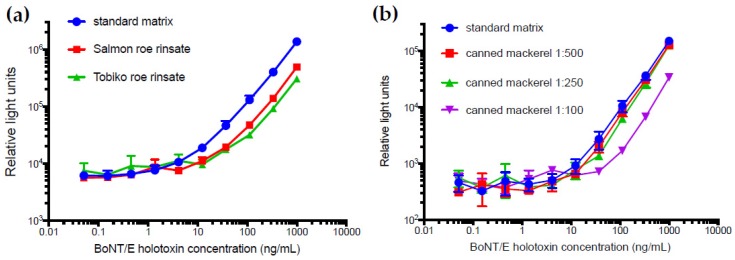
Figure 5.
Analysis of matrix effects in the BoNT/E3 holotxin sandwich ELISA. The matrices (a) Salmon and Tobiko roe rinsates and (b) canned mackerel at dilutions of 1:100, 1:250, and 1:500 were spiked with BoNT/E3 holotoxin and are shown alongside the standard curve (blue circles) using 3% non-fat dried milk in tris buffered saline with Tween 20 (TBST) as the matrix. Where not visible, error bars are within the symbols.

