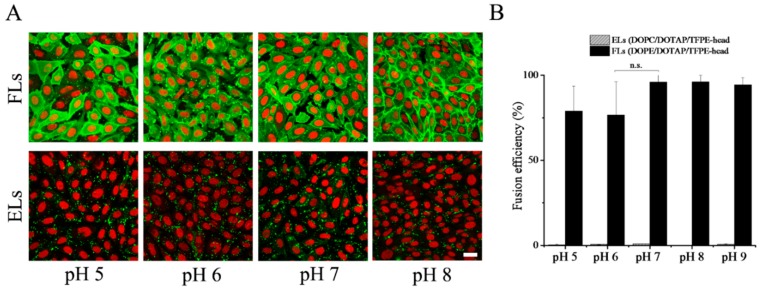
Figure 5.
(A) Fluorescence micrographs of CHO cells after treatment with fusogenic (DOPE/DOTAP/TFPE-head, 1/1/0.1 mol/mol), upper row, and endocytic liposomes (DOPC/DOTAP/TFPE-head, 1/1/0.1 mol/mol), lower row, at different pH values. Green: TFPE-head signal, red: Nucleic staining with DRAQ5. Scale bar, 20 µm, applies to all. (B) Fusion efficiencies. Whiskers indicate standard deviations of at least three independent experiments.

