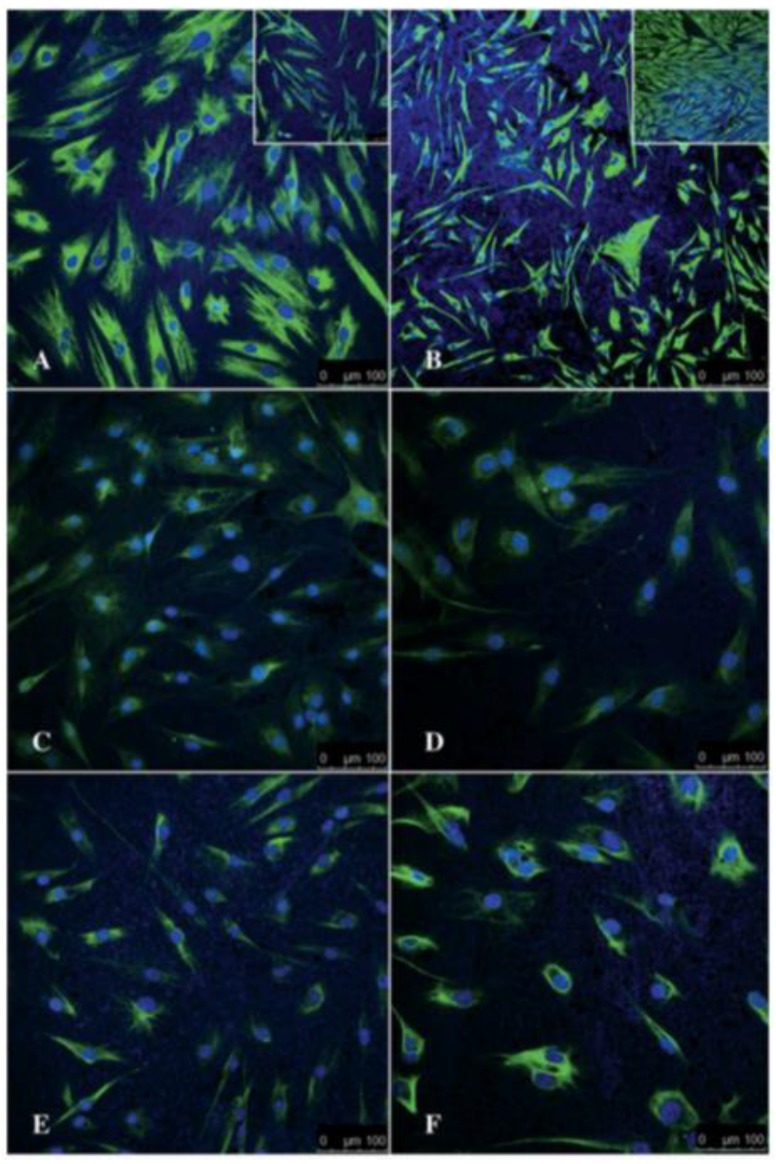
Figure 10.
Representative 2D confocal microscopy images of hMSCs differentiating into cells of neural lineage on an AuNR substrate. Images show the expression of Vimentin, S100β, and GFAP at 24 h (A, C, and E, respectively) and 6 days (B, D, and F, respectively) after differentiation. The insets in A and B show the corresponding undifferentiated controls at 24 h and 6 days. Scale bar = 100 μm. Reproduced with permission from [9]. Springer Nature, 2014.

