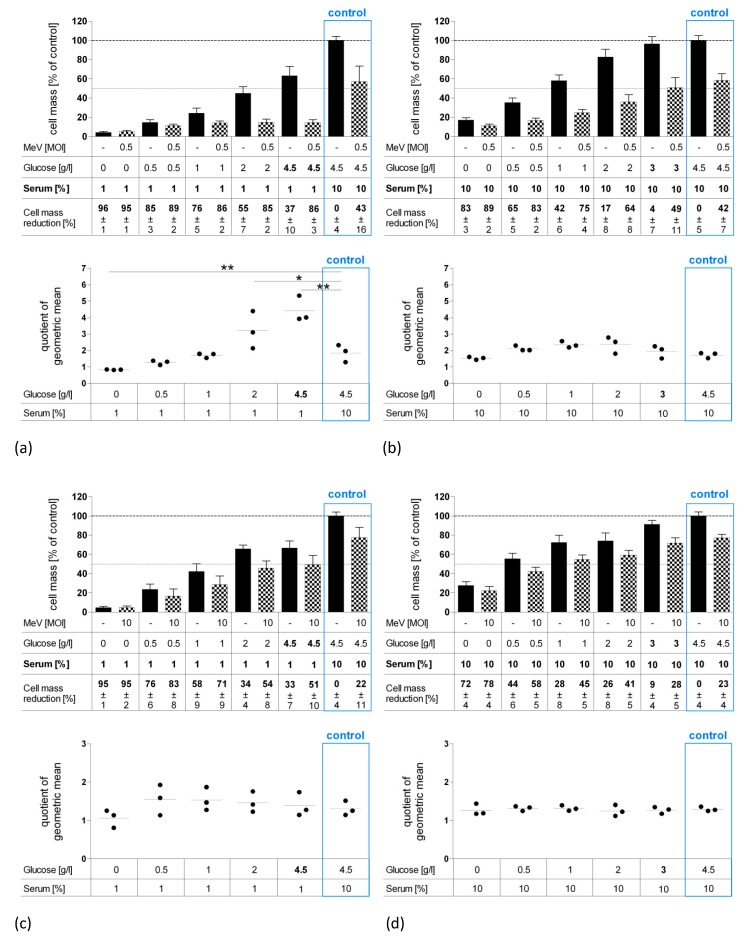
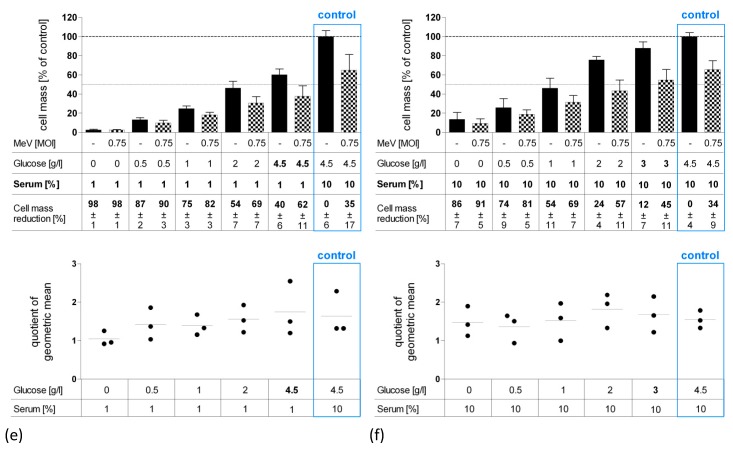
Figure 4.
Effect of long-term starvation (120 h) on MeV-mediated oncolysis in HT-29 (a,b), HCT-15 (c,d) and HCT-116 (e,f) cells. Long-term starvation of HT-29, HCT-15 and HCT-116 cells was performed according to Figure 1b. On day 1, medium was changed to low-glucose, low-serum medium (a,c,e) or low-glucose, standard serum medium (b,d,f). At 96 hpi, remaining tumor cell masses were determined by SRB assay. Differences were considered significant when P-values were <0.05 (*) or <0.01 (**). Differences in glucose and serum concentrations are pointed out in bold face.


