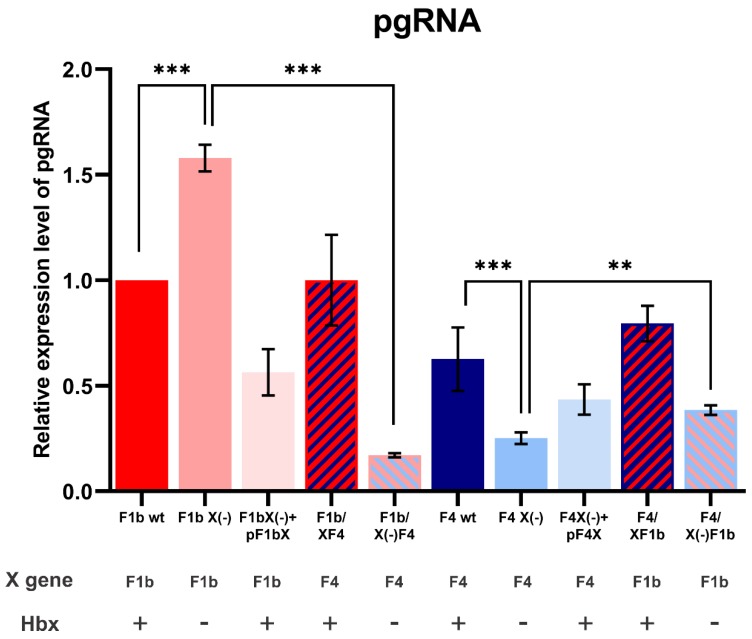
Figure 5.
Analysis of pgRNA levels of sgtF1b and sgtF4 variants. HuH-7 cells were transfected with linear full-length HBV genomes F1b wt, F1b X(-), F1b X(-)+pF1bX, F1b/XF4, F1b/X(-)F4, F4 wt, F4 X(-), F4 X(-)+pF4X, F4/XF1b and F4/X(-)F1b variants. Seventy-two hours post-transfection, total RNA was extracted and pgRNA was quantified by RT-qPCR using specific primers. β-actin amplification was used to normalize each RNA sample. Shown values represent the mean ± standard deviation of three independent experiments. ** p < 0.005 and *** p < 0.0001.

