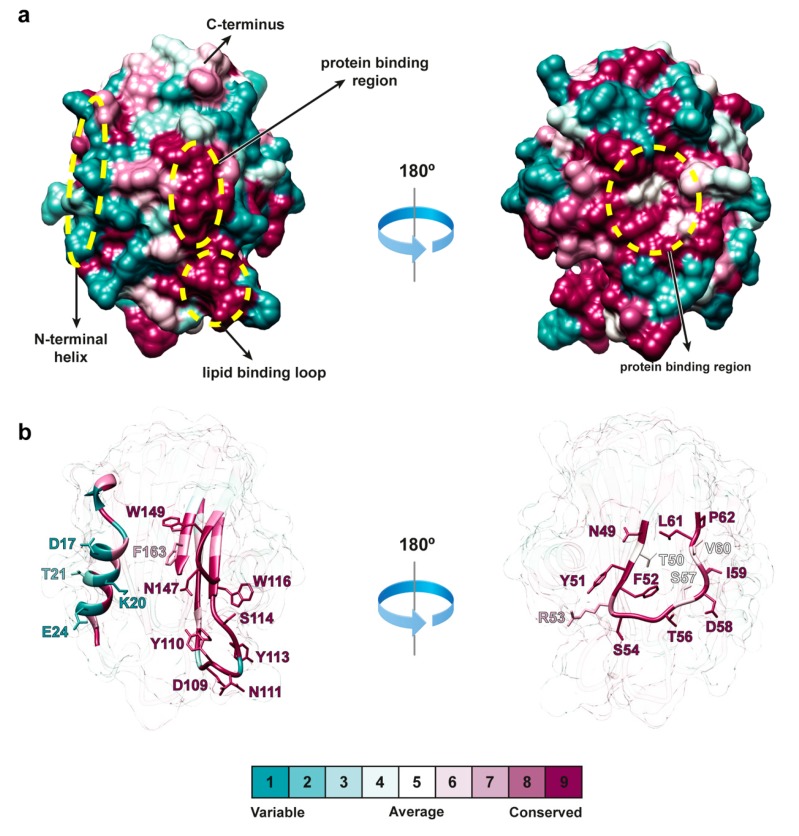
Figure 6.
Evolutionary variability of actinoporins. (a) Surface area representation of FraE (PDB code 6K2G, this work) color-coded according to the evolutionary variability of actinoporins (see color legend). The N-terminal helix, the protein-binding region and the lipid-binding region are circled in yellow. These three regions are shown in ribbon representation in (b). Mapping the evolutionary variability of residues on the crystal structure was made in the Consurf server [33].

