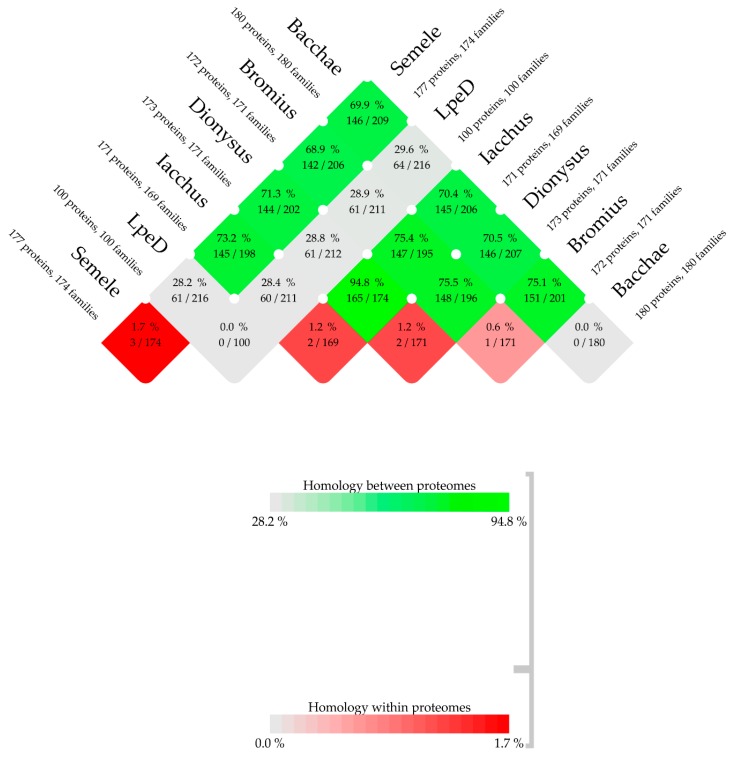
Figure 4.
BLASTp comparison between and within proteomes of the five phages and their closest phage relative LpeD using CMG-biotools system. Phage pairs with >50% proteome homology are shown in green and those with <50% are depicted in grey. Red signifies the presence of one or more groups of paralogous proteins within a phage proteome.

