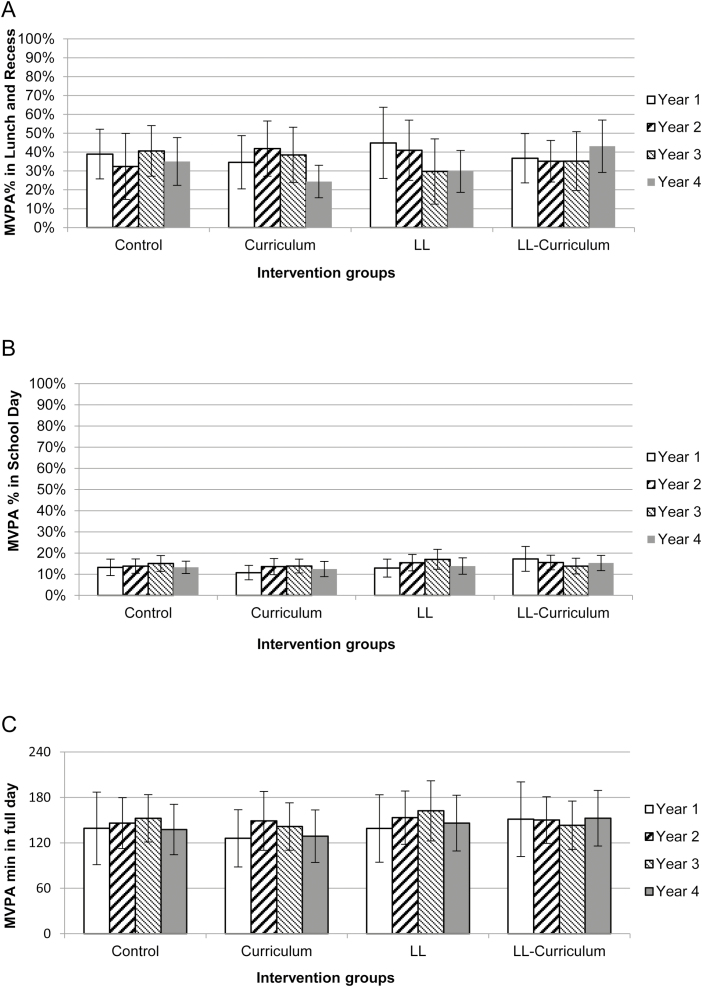
Fig 3 |.
Accelerometer outcomes for means (SD) of percentage of lunch and recess time in moderate- to vigorous-intensity physical activity (MVPA) per day (A), percentage of school day time in MVPA per day (B), and minutes per day in MVPA (C), by intervention group and year. The linear mixed-effects model was used to analyze accelerometer data with children nested within school as a random effect. Percentage of lunch and recess time in MVPA: Intervention × Time interaction, p < .0001. Percentage of school day time in MVPA: Intervention × Time interaction, p < .0001. Tukey–Kramer multiple comparison adjustments were used to assess pairwise comparisons of intervention groups for percentage of school day time in MVPA at Y1 with significant differences between some: LL (learning landscape)-Curriculum was higher versus Control, adjusted p = .011; LL-Curriculum was higher versus Curriculum, adjusted p < .0001; and LL-Curriculum was higher versus LL, adjusted p < .0001. Minutes per day of MVPA: Intervention × Time interaction, p = .0012.

