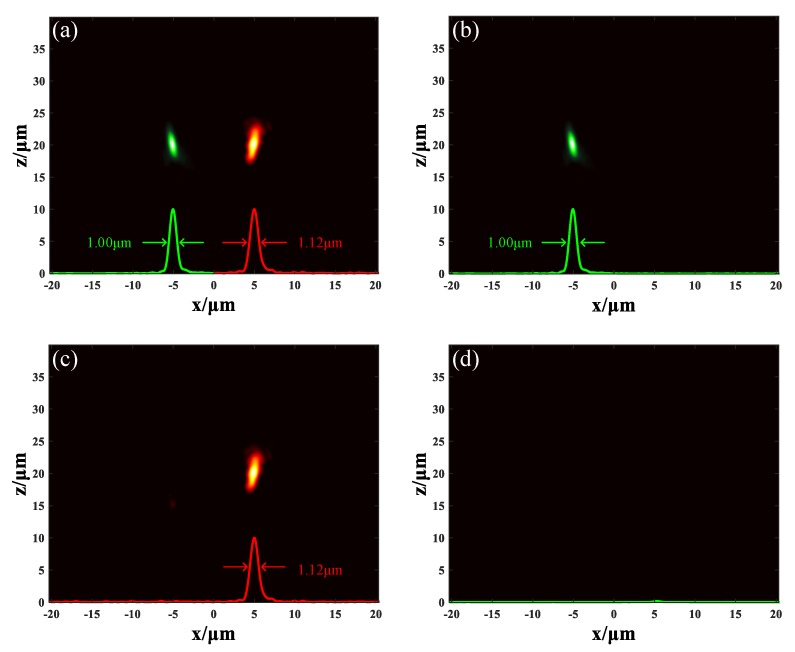
Figure 7.
The light field distribution of metalens M3. The red profile and green profile indicate the 1.55 μm and 1.31 μm light respectively. (a) The GST in both sections are in amorphous state. (b) The GST in section A stays in amorphous state but the GST in section B stays in crystalline state. (c) The GST in section A stays in crystalline state but the GST in section B stays in amorphous state. (d) The GST in both sections are in crystalline state.

