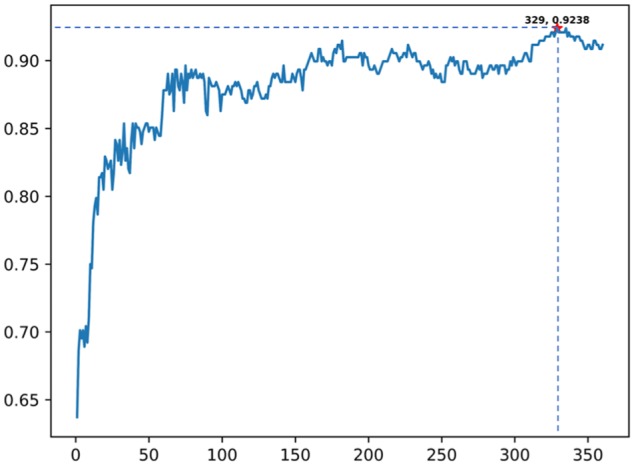
Figure 3.

The IFS curve shows feature extraction process using F-score of different features in dipeptide composition (T = 5, C = 19). An IFS peak of 92.38% was obtained when using the 329 optimal features. IFS indicates incremental feature selection.
