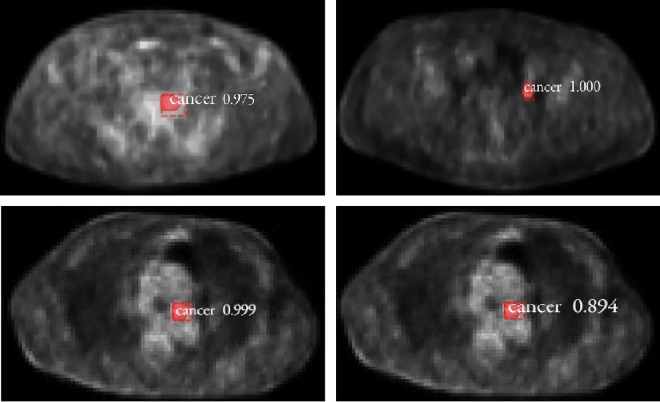
Figure 7.
Staggered spatial distribution for false positives. Top left image, A false positive was extracted in Model-512 but not in Model-768 and Model-1024. Top right image, A false positive was detected in Model-768 but not in Model-512 and Model-1024. Below left image and below right image, The test results of same slice for Model-768 and Model-1024. It showed that a false positive was detected in Model-768 and Model-1024 respectively but not in Model-512.

