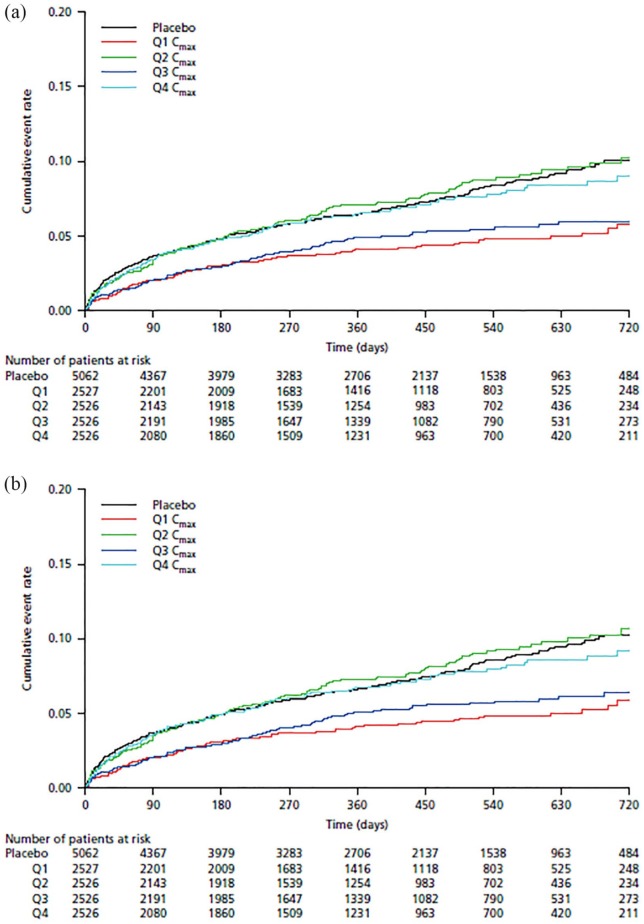
Figure 1.
Kaplan–Meier plots of the cumulative event rate of the composite efficacy outcomes of (a) myocardial infarction, ischemic stroke, or nonhemorrhagic cardiovascular death and (b) myocardial infarction, ischemic stroke, or death from all causes versus predicted steady-state maximum concentration of rivaroxaban.
Cmax, steady-state maximum plasma concentration; Q1, first quartile; Q2, second quartile; Q3, third quartile; Q4, fourth quartile.

