Figure 2.
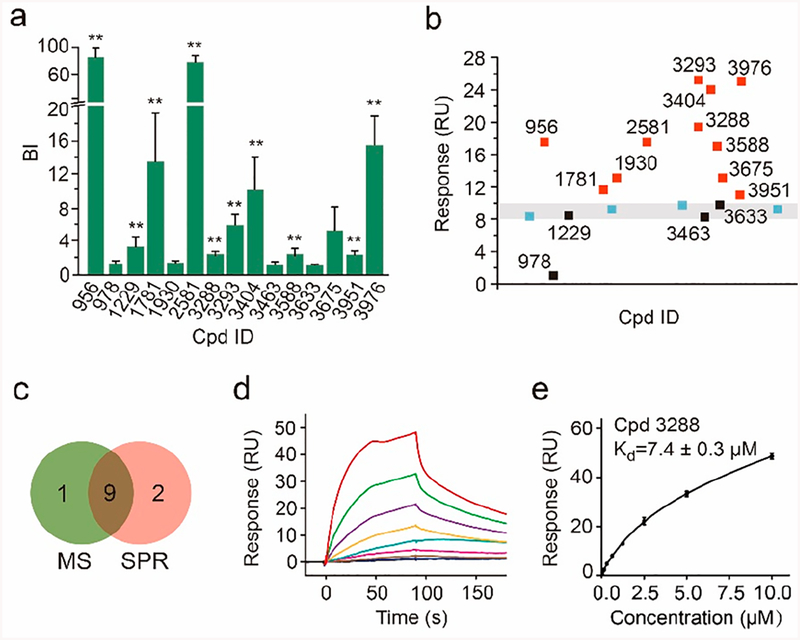
Validation of putative A2AR ligands by affinity MS and SPR. (a) Affinity MS assay on a mixture of 15 putative ligands. Confirmed ligands (mean BI > 2, P < 0.01, and n = 4) are designated by asterisks. (b) SPR analysis of 15 putative ligands (each tested at 1 μM). Verified ligands (response > 10 RU), nonbinders and blank controls are represented by red, black, and blue squares, respectively. (c) Overlap of verified ligands by affinity MS and SPR. SPR sensorgrams (d) and the binding curve (e) of a verified ligand 3288. SPR data are shown as means of duplicate measurements at each concentration (0.04−10 μM). Cpd, compound.

