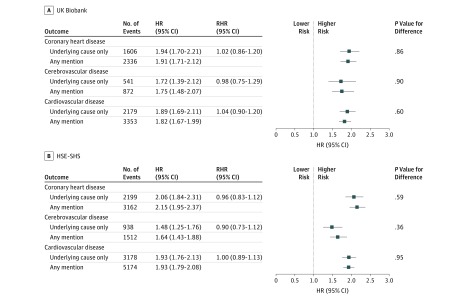
Figure 3. Association of Hypertension Status With Cardiovascular Disease Mortality in the UK Biobank (N = 492 513) and the Health Survey for England and Scottish Health Surveys (HSE-SHS; N = 117 606).
Shaded squares indicate the hazard ratios (HRs), and error bars denote the 95% CIs for the association of hypertension status with the risk of death from different presentations of cardiovascular disease. The reference group is not having hypertension. The ratio of hazard ratios (RHR) summarizes the difference, with underlying cause as the reference group, between the effect estimate for the outcome as ascertained from different locations on the death certificate. The number of study participants and deaths in the sample used in this survival analysis is marginally lower than the full cohort owing to missing data for the exposure of interest.

