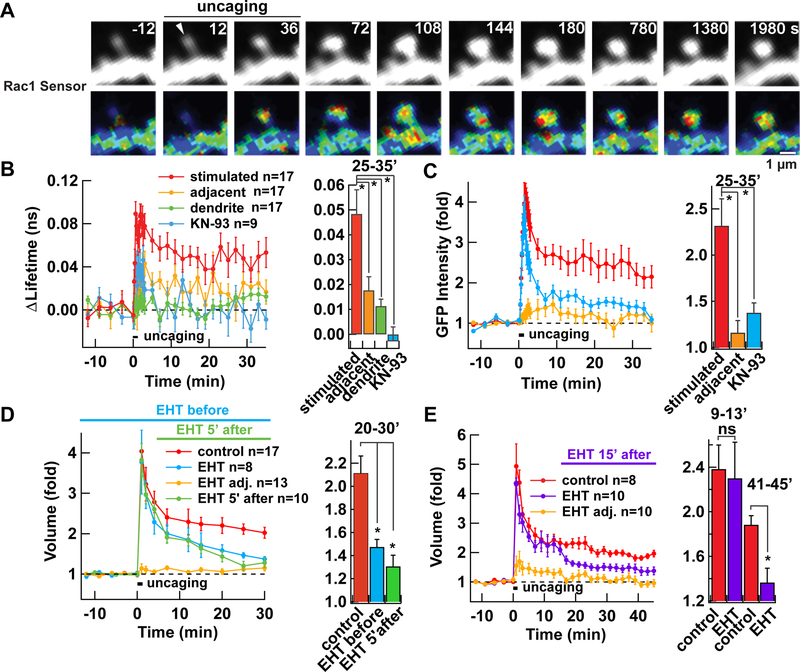
Figure 1. Persistent Rac1 activation is required for sLTP in hippocampal organotypic slice culture.
A. Activation of Rac1 as visualized by FRET-FLIM-based Rac1 activity sensor during sLTP induced by uncaging caged glutamate at 0.5 Hz for 1 min. Rac1 activity and distribution of GFP-Rac1, as a proxy of structure, are shown. Warmer colour hues in FLIM images indicate higher Rac1 activity. Arrowhead indicates the position of photo-uncaging.
B. Averaged time course of Rac1 activation measured as a change in the lifetime of GFP-Rac1 from baseline in stimulated spines (stimulated, red), the dendritic shaft below the stimulated spines (dendrite, green), and adjacent spines (adjacent, yellow). Data from spines stimulated in the presence of CaMKII inhibitor KN-93 are also shown (blue). *, p < 0.05, compared to stimulated spines; one-way ANOVA with the Dunnett’s post-hoc test comparisons.
C. Averaged time course of GFP-Rac1 fluorescence intensity, measured as a proxy of volume change. *, p < 0.05, compared to stimulated spines; one-way ANOVA with the Dunnett’s post-hoc test comparisons.
D-E. Effect of Rac1 inhibitor EHT1864, applied 30 min before (blue) or 5 min after (green) (D), or 15 min after (purple) (E) induction of sLTP. Spines were visualized by expressing untagged GFP. *, p < 0.05, compared to control; ns, not significant; one-way ANOVA with the Dunnett’s post-hoc test comparisons.
Data are represented as mean ± SEM (B-E).
See also Figure S1.

