Figure 3.

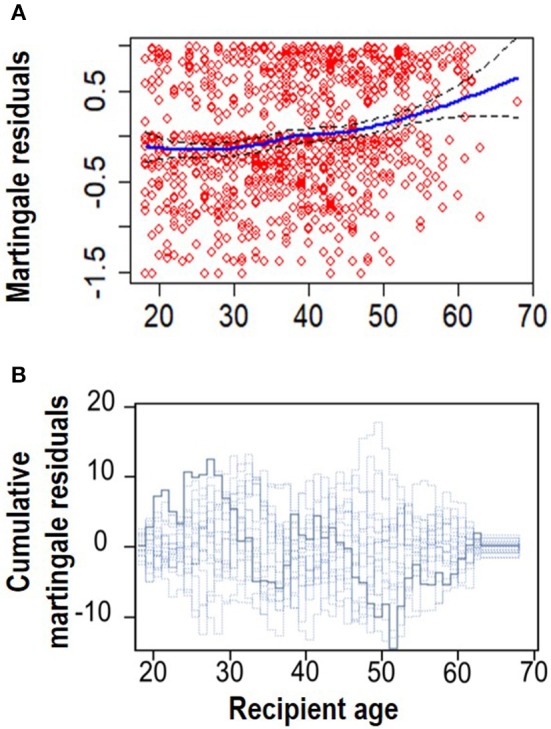
Linearity assumption assessment. (A) Smoothed martingale residual plot from a null Cox PH model vs. recipient age. (B) Cumulative martingale residuals plot vs. recipient age (p = 0.095).

Linearity assumption assessment. (A) Smoothed martingale residual plot from a null Cox PH model vs. recipient age. (B) Cumulative martingale residuals plot vs. recipient age (p = 0.095).