
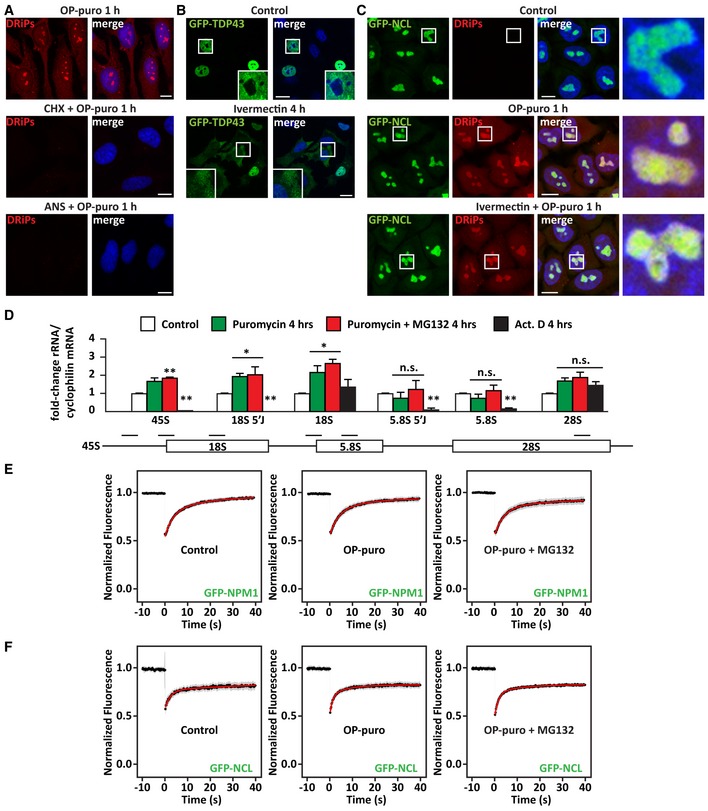
Figure EV1. DRiPs accumulate in subnucleolar compartments, without affecting the dynamics of NCL and NPM1 (related to Fig 1).
-
ADRiP labeling in HeLa cells that were treated with OP‐puro (25 μM) alone or combined with the translation inhibitors CHX (50 μg/ml) and anisomycin (ANS; 5 μg/ml). Scale bars: 10 μm.
-
BHela cells overexpressing GFP‐TDP43 were left untreated or treated with the nuclear import inhibitor ivermectin (25 μM) for 4 h, prior to fixation and imaging. Scale bars: 20 μm.
-
CDRiP labeling in GFP‐NCL HeLa Kyoto cells that were left untreated (Control) or treated with OP‐puro (25 μM) alone or combined with Ivermectin (25 μM). Scale bars: 10 μm.
-
DRT–qPCR analysis of the expression levels of precursor and mature ribosomal RNAs in HeLa cells treated as described (MG132 10 μM; puromycin 10 μg/μl; actinomycin D/Act.D 4 μM). Statistical significance via one‐way ANOVA; *P = 0.01; **P = 0.001; n = 3 independent experiments, ± s.e.m. Approximate location of the qPCR primers is shown: 45S, 18S 5′J (5′ Junction); 18S; 5.8S 5′J (5′ Junction); and 5.8S; 28S (from left to right).
-
E, FQuantitation of the fluorescence intensity recovery after photobleaching (FRAP) of GFP‐NPM1 (E) and GFP‐NCL (F). Cells were left untreated, or treated with OP‐puro alone (25 μM), or combined with MG132 (20 μM). The average recovery curve (N = 17–22) is shown in black, while the fitting curve is shown in red. Gray shows the SD.