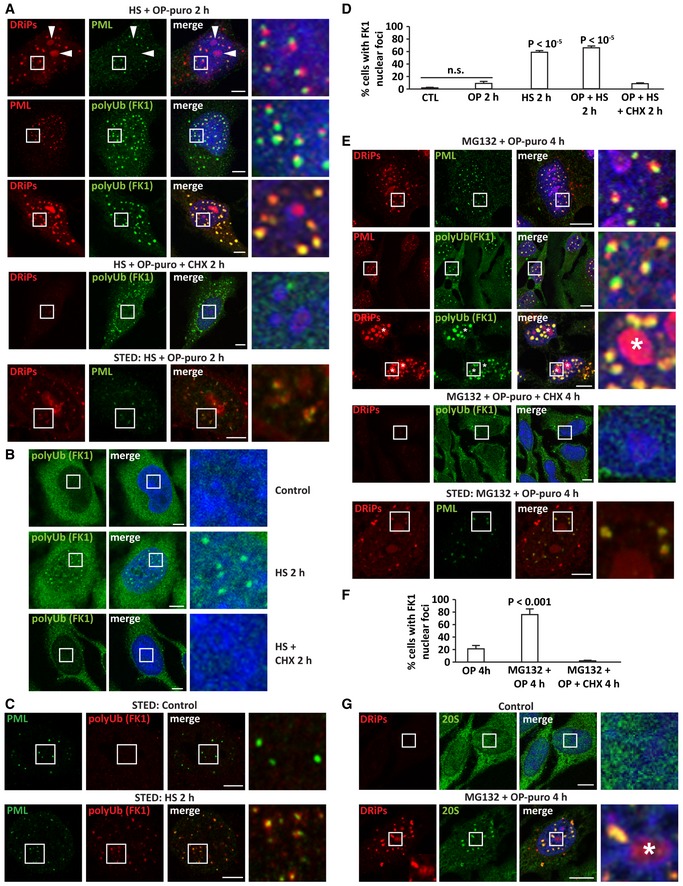
DRiPs, polyUb proteins (FK1), and PML labeling in HeLa cells treated with OP‐puro (25 μM) and heat shock (HS) at 42°C for 2 h; where indicated, cycloheximide was also added (CHX; 50 μg/ml). Lower panel: STED super‐resolution microscopy showing colocalization of DRiPs with PML‐NBs in PML‐GFP HeLa cells treated with a low concentration of OP‐puro (5 μM) and heat shock (HS) at 42°C for 2 h. PML‐NBs were visualized using a PML specific antibody, followed by incubation with Alexa Fluor 647. For convenience, the Alexa Fluor 647 signal is shown in green. Scale bars: 5 μm.
PolyUb proteins (FK1) labeling in HeLa cells left untreated or treated with HS at 42°C for 2 h, alone or combined with CHX (50 μg/ml). Scale bars: 5 μm.
STED super‐resolution microscopy showing colocalization of endogenous polyUb proteins (FK1) and PML‐NBs in PML‐GFP HeLa cells treated with HS at 42°C for 2 h. Scale bars: 5 μm.
Quantitation of cells shown in (A–C). Number of cells counted/condition: 712–1,343 in three independent experiments; statistical significance via one‐way ANOVA; P < 10−5, ± s.e.m.
DRiPs, polyUb proteins (FK1), and PML labeling in HeLa cells treated with MG132 (10 μM) and OP‐puro (25 μM) for 4 h; where indicated, cycloheximide was also added (CHX; 50 μg/ml). Asterisks (*) indicate nucleoli. Scale bars: 10 μm. Lower panel: STED super‐resolution microscopy showing colocalization of DRiPs with PML‐NBs in PML‐GFP HeLa cells treated with a low concentration of OP‐puro (5 μM) and MG132 (10 μM) for 4 h. Scale bars: 5 μm.
Quantitation of cells shown in E. Number of cells counted/condition: 298–1,713 in three independent experiments; statistical significance via one‐way ANOVA; P ≤ 0.001, ± s.e.m.
Intranuclear distribution of 20S proteasomes in HeLa cells left untreated or treated with MG132 (10 μM) and OP‐puro (25 μM) for 4 h. Asterisks (*) indicate nucleoli. Scale bars: 10 μm.