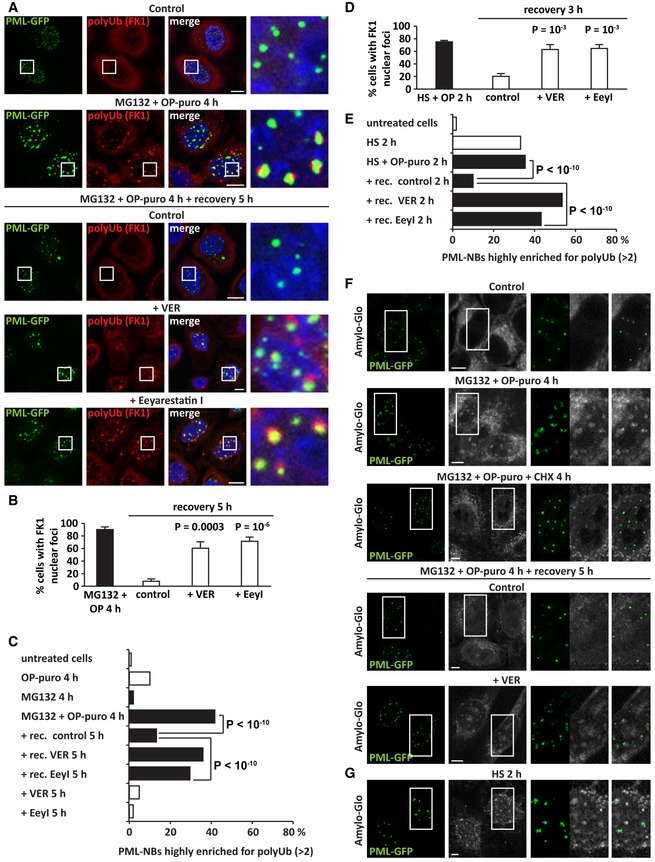
PolyUb protein (FK1) labeling in PML‐GFP HeLa Kyoto cells that were either left untreated or treated with MG132 (10 μM) and OP‐puro (25 μM) for 4 h. Cells were either immediately fixed or let to recover for 5 h in drug‐free medium (Control), with VER (40 μM) or Eeyarestatin I (5 μM). Scale bars: 10 μm.
Quantitation of the % of cells with polyUb (FK1) nuclear foci shown in (A). Number of cells counted/condition: 310–1,258 in three independent experiments; statistical significance via one‐way ANOVA; P = 0.0003 or 10−6, ± s.e.m.
Quantitation of the number of PML‐NBs enriched for polyUb (> 2) in cells treated as described; n = 611–2,612; statistical significance via one‐way ANOVA; P < 10−10. Automated PML‐NB segmentation is based on PML signal.
Quantitation of the % of cells with polyUb proteins (FK1) sequestered in nuclear foci. HeLa cells were treated with OP‐puro (25 μM) and heat shock (HS) at 42°C for 2 h. Then, cells were either immediately fixed or let to recover for 3 h in drug‐free medium (control), with VER (40 μM) or Eeyarestatin I (5 μM). Number of cells counted/condition: 593–1,016 in three independent experiments; statistical significance via one‐way ANOVA; P = 10−3, ± s.e.m.
Quantitation of the number of PML‐NBs enriched for polyUb (> 2) in HeLa cells treated as described in (D) but with a recovery time of 2 h; n = 1,155–3,283; statistical significance via one‐way ANOVA; P < 10−10. Automated PML‐NB segmentation is based on PML signal.
Amylo‐Glo staining of PML‐GFP HeLa Kyoto cells that were subjected to the following treatments: untreated (Control), MG132 (10 μM), and OP‐puro (25 μM) for 4 h, alone or combined with CHX (50 μg/ml). Where indicated, cells were allowed to recover for 5 h in drug‐free medium (Control) or with VER (40 μM). Confocal images showing Amylo‐Glo and PML‐GFP. Scale bars: 5 μm.
Amylo‐Glo staining of PML‐GFP HeLa Kyoto cells that were subjected to heat shock (HS) at 42°C for 2 h. Confocal images showing Amylo‐Glo and PML‐GFP. Scale bars: 5 μm.