-
A
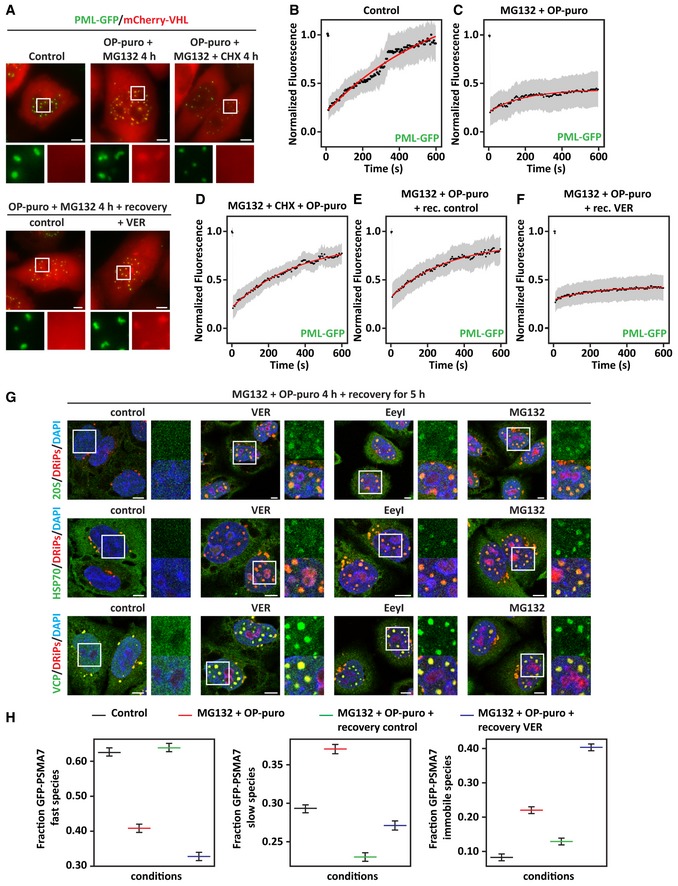
PML‐GFP HeLa Kyoto cells were lipofected with a cDNA encoding for mCherry‐VHL. 24 h post‐transfection, cells were left untreated or treated with MG132 (10 μM) and OP‐puro (25 μM) for 4 h. Where indicated (OP‐puro + MG132 + CHX), translation was inhibited during stress with cycloheximide (CHX; 50 μg/ml). In the lower panel, cells were allowed to recover for 5 h in drug‐free medium (Control) or with VER (40 μM). The subcellular distribution of PML‐GFP and mCherry‐VHL was studied by live‐cell confocal imaging. Representative pictures are shown. Scale bars: 5 μm.
-
B–F
Quantitation of the fluorescence intensity recovery after bleach of PML‐GFP. PML‐GFP HeLa Kyoto overexpressing mCherry‐VHL for 24 h and treated as described in (A) were analyzed. The mean of 19–23 FRAP curves and the fitting curves are shown in black and red, respectively. In gray, the SD is shown.
-
G
Intranuclear distribution of 20S proteasomes, HSP70, VCP, and DRiPs in HeLa cells treated with MG132 (10 μM) and OP‐puro (25 μM) for 4 h and allowed to recover for 5 h in drug‐free medium (control), with VER (40 μM), Eeyarestatin I (5 μM), or MG132 (10 μM). Scale bars: 5 μm.
-
H
GFP‐PSMA7 HeLa Kyoto cells were left untreated or treated as described in A. Cells were subjected to FRAP to analyze GFP‐PSMA7 mobility. Quantitation of three populations of GFP‐PSMA7 molecules is shown: fast moving, slow moving, and immobile; statistical significance via one‐way ANOVA; n = 12–14 ± SEM.

