
Figure 6. EGAD‐degradation of Orm2 contributes to sphingolipid homeostasis.
See also Fig EV5.
-
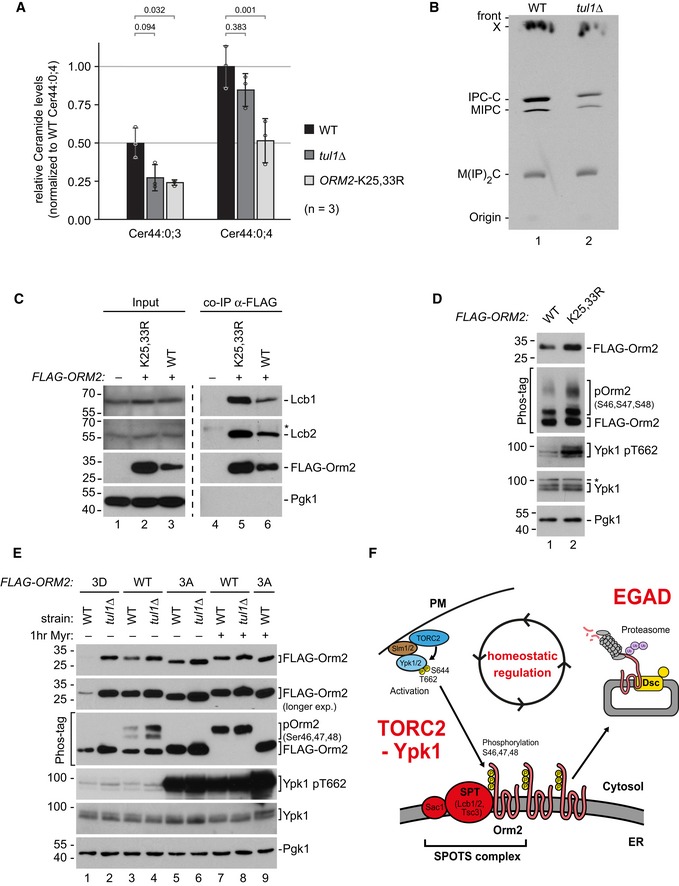
AThe levels of two major ceramide (Cer) species in lipid extracts from WT (black), tul1Δ (dark gray), or Orm2‐K25,33R mutants (light gray) were measured using LC‐MS and quantified using spiked non‐yeast ceramides as internal standard. Data are normalized to Cer44:0;4 levels of WT cells (set to 1) and presented as mean ± standard deviation from three independent experiments. Pairwise statistical significance was assessed by Student's t‐test. P values are given above the respective bars.
-
BThin‐layer chromatography of sphingolipid extracts from [3H]serine radiolabelled WT cells and tul1Δ mutants was analyzed by autoradiography. IPC, inositolphosphorylceramide; MIPC, mannosylinositolphosphorylceramide; MIP2C, mannosyldiinositolphosphorylceramide. X indicates an unknown lipid species that is insensitive to myriocin treatment.
-
CSDS–PAGE and Western blot analysis with the indicated antibodies of input and elution (with FLAG peptide) from native anti‐FLAG co‐immunoprecipitations from cells expressing FLAG‐Orm2‐WT or FLAG‐Orm2‐K25,33R. Control cells expressed untagged Orm2 WT.
-
D, ESDS–PAGE or Phos‐tag SDS–PAGE and Western blot analysis with the indicated antibodies of total cell lysates (D) from WT cells expressing FLAG‐Orm2 or FLAG‐Orm2‐K25,33R; (E) from WT cells and tul1Δ mutants expressing FLAG‐Orm2, FLAG‐Orm2‐3A, or FLAG‐Orm2‐3D with or without myriocin treatment (1.5 μM) for 1 h.
-
FSchematic representation of the regulation of SPT activity via TORC2‐Ypk1/2‐dependent phosphorylation of Orm proteins and EGAD‐dependent degradation of Orm2.