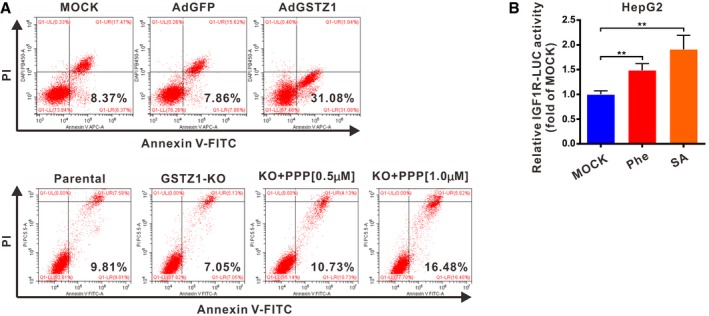
Flow cytometry detection of apoptosis, conducted using Annexin V–FITC/PI double staining in GSTZ1‐1‐overexpressing (GSTZ1‐OE) Huh7 (top) and GSTZ1 knockout (GSTZ1‐KO) HepG2 (bottom) cells. GSTZ1‐KO cells were treated with or without different doses of PPP (0.5 μM and 1.0 μM) for 24 h.
Luciferase activity of human IGF1R promoter in HepG2 cells treated with Phe (2.0 mM) and SA (200 μΜ) for 36 h. Values are shown as means ± SD (n = 3), **P < 0.01, one‐way ANOVA followed by the Tukey test.
Data information: Abbreviations: Phe, phenylalanine; SA, succinylacetone; AdGFP, adenoviruses expressing GFP; AdGSTZ1, adenoviruses expressing GSTZ1‐1; PPP, picropodophyllin.

