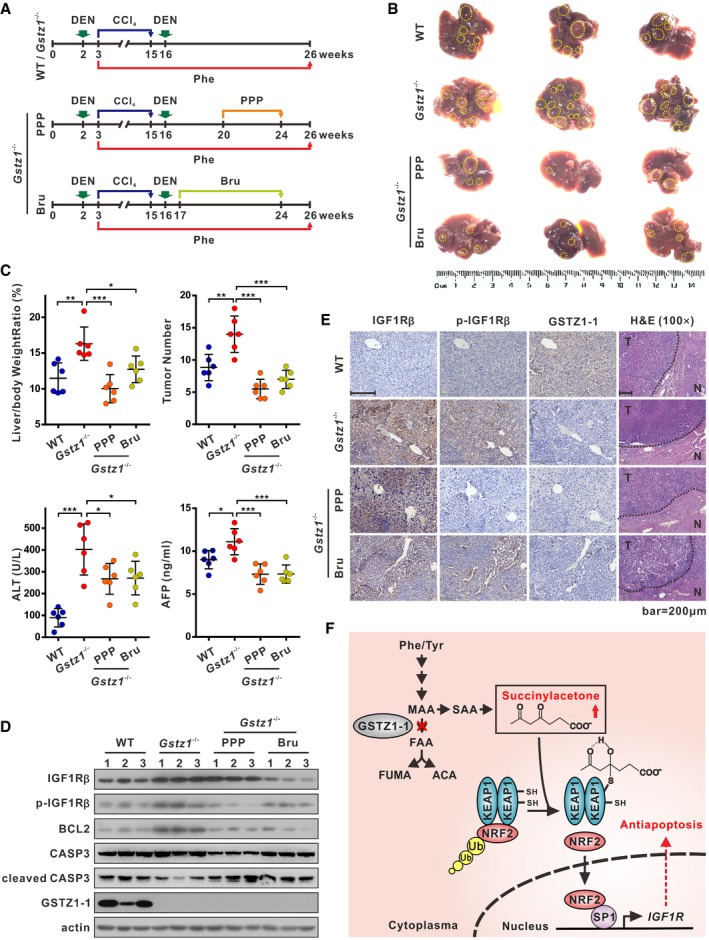
Schematics showing experimental design for procedures involving wild‐type (WT) and Gstz1
−/− mice.
Gross appearances of liver with tumors. The yellow dotted‐line circles represent tumors.
Liver/body weight ratio (top left), tumor numbers (top right), and serum alanine aminotransferase (ALT) (bottom left) and alpha‐fetoprotein (AFP) (bottom right) levels of the four groups.
Protein expression of IGF1Rβ, phospho (Tyr1131)‐IGF1Rβ, B cell lymphoma/leukemia‐2 protein (BCL2), and caspase 3 (CASP3) in four groups of liver tumors as assessed by Western blotting.
Representative images of GSTZ1‐1, and corresponding IGF1Rβ and phospho (Tyr1161)‐IGF1Rβ immunohistochemical labeling, and H&E staining in liver tumors. Scale bars: 200 μm.
A proposed model of activation of the NRF2/IGF1R axis in HCC.
Data information: Values are shown as means ± SD obtained using six mice in each group, *
P < 0.05, **
P < 0.01, ***
P < 0.001, one‐way ANOVA followed by the Tukey test
. Abbreviations: DEN, diethylnitrosamine; CCl
4, carbon tetrachloride; Phe, phenylalanine; PPP, picropodophyllin; Bru, brusatol; H&E, hematoxylin–eosin; N, non‐tumor; T, tumor; Tyr, tyrosine; MAA, maleylacetoacetate; FAA, fumarylacetoacetate; FUMA, fumarate; ACA, acetoacetate; SAA, succinylacetoacetate; SA, succinylacetone; Ub, ubiquitination.
Source data are available online for this figure.